Trendline v5.0
Trendline v5.0 turns choppy, directionless price action into clearly marked reversal setups on TradingView - now with a redrawn, at-a-glance trade panel. Most tools fire an arrow every time RSI hits an extreme, even mid-trend. Trendline v5.0 waits for a genuine range first, then paints the whole plan - reward zone, risk zone and result - as clean boxes right on the chart.
Key benefits
- Signals only where they belong - the default mode stays silent in trends and speaks up only in real ranges.
- A visual trade plan on every signal - Entry, an ATR-based stop and up to three targets are drawn instantly as a green reward box and a red risk box.
- See the outcome, not just the entry - each closed trade is stamped with a WIN xR or SL -1R label plus the bars it took, and small green dots mark every interim target reached.
- Four engines in one - switch to EMA-stack or RSI-crossover modes to trade with the trend.
- Less signal spam - cooldown, Stability Mode (on by default), an optional Smart Signal Filter and a session-time window keep signals selective.
- Automation-ready alerts - structured JSON on bar close with symbol, entry, stop and targets.
How it works
A stepped, range-based average classifies the market as rising, falling or flat and colours your candles to match. In flat conditions it waits for RSI to reverse at the edge of the 50-bar range, then projects a reward/risk box forward from the entry. Full rules are in the Manual.
What's included
- TradingView access to Trendline v5.0 (Pine Script v6 overlay)
- Four signal modes, adjustable Sensitivity and Signal Strength
- Automatic Entry / Stop Loss / TP1-TP3 drawn as reward and risk boxes with breakeven handling
- On-chart WIN / SL result labels, interim target dots and a compact performance dashboard
- JSON alerts and ready-made TradingView alert conditions
Best for
FX majors, gold, index CFDs and large-cap crypto on M15 to H4 - for intraday and swing traders who prefer mean-reversion entries with a defined stop.
Get started
Browse the ZynAlgo marketplace
Trading involves risk; no indicator predicts the market. Trendline v5.0 is an analysis tool, not financial advice.
Trendline v5.0
Reading range reversals with Trendline v5.0
Trendline v5.0 is built around one question: is this market actually going somewhere right now, or is it just drifting? Rather than producing signals in every condition, its default engine deliberately stays quiet while a trend is running and only starts looking for entries once price has flattened out.
To make that judgement the indicator watches four things at once:
- A smoothed, range-based moving average that classifies the market as rising, falling or flat
- RSI - its level, and more importantly the bar on which it turns
- Where price sits inside the high-low range of the last 50 bars
- ATR(14), which sets how far the stop sits and how far the targets are spaced
Trendline v5.0 also ships three alternative engines for traders who prefer to trade with the trend: Mode 1 (pullback onto a stacked EMA set), Mode 2 (the bar three EMAs first stack in order) and Mode 3 (a fast/slow crossover calculated on RSI). Mode 4 is the default and is the mode this manual focuses on.
The result is a smaller number of more selective reversal signals on TradingView - and, new in v5.0, every one arrives as a fully drawn trade panel: a green reward box up to the target, a red risk box down to the stop, and a result label once the trade closes.
Understanding the Sentiment Range MA
The Sentiment Range MA is the component that decides whether Trendline v5.0 is allowed to trade at all. It is a stepped average that holds its value while price stays inside an ATR-sized band and only re-centres when price pushes out of that band. Because it moves in steps rather than tracking every tick, its slope is a clean read on whether the market is genuinely trending or simply oscillating.
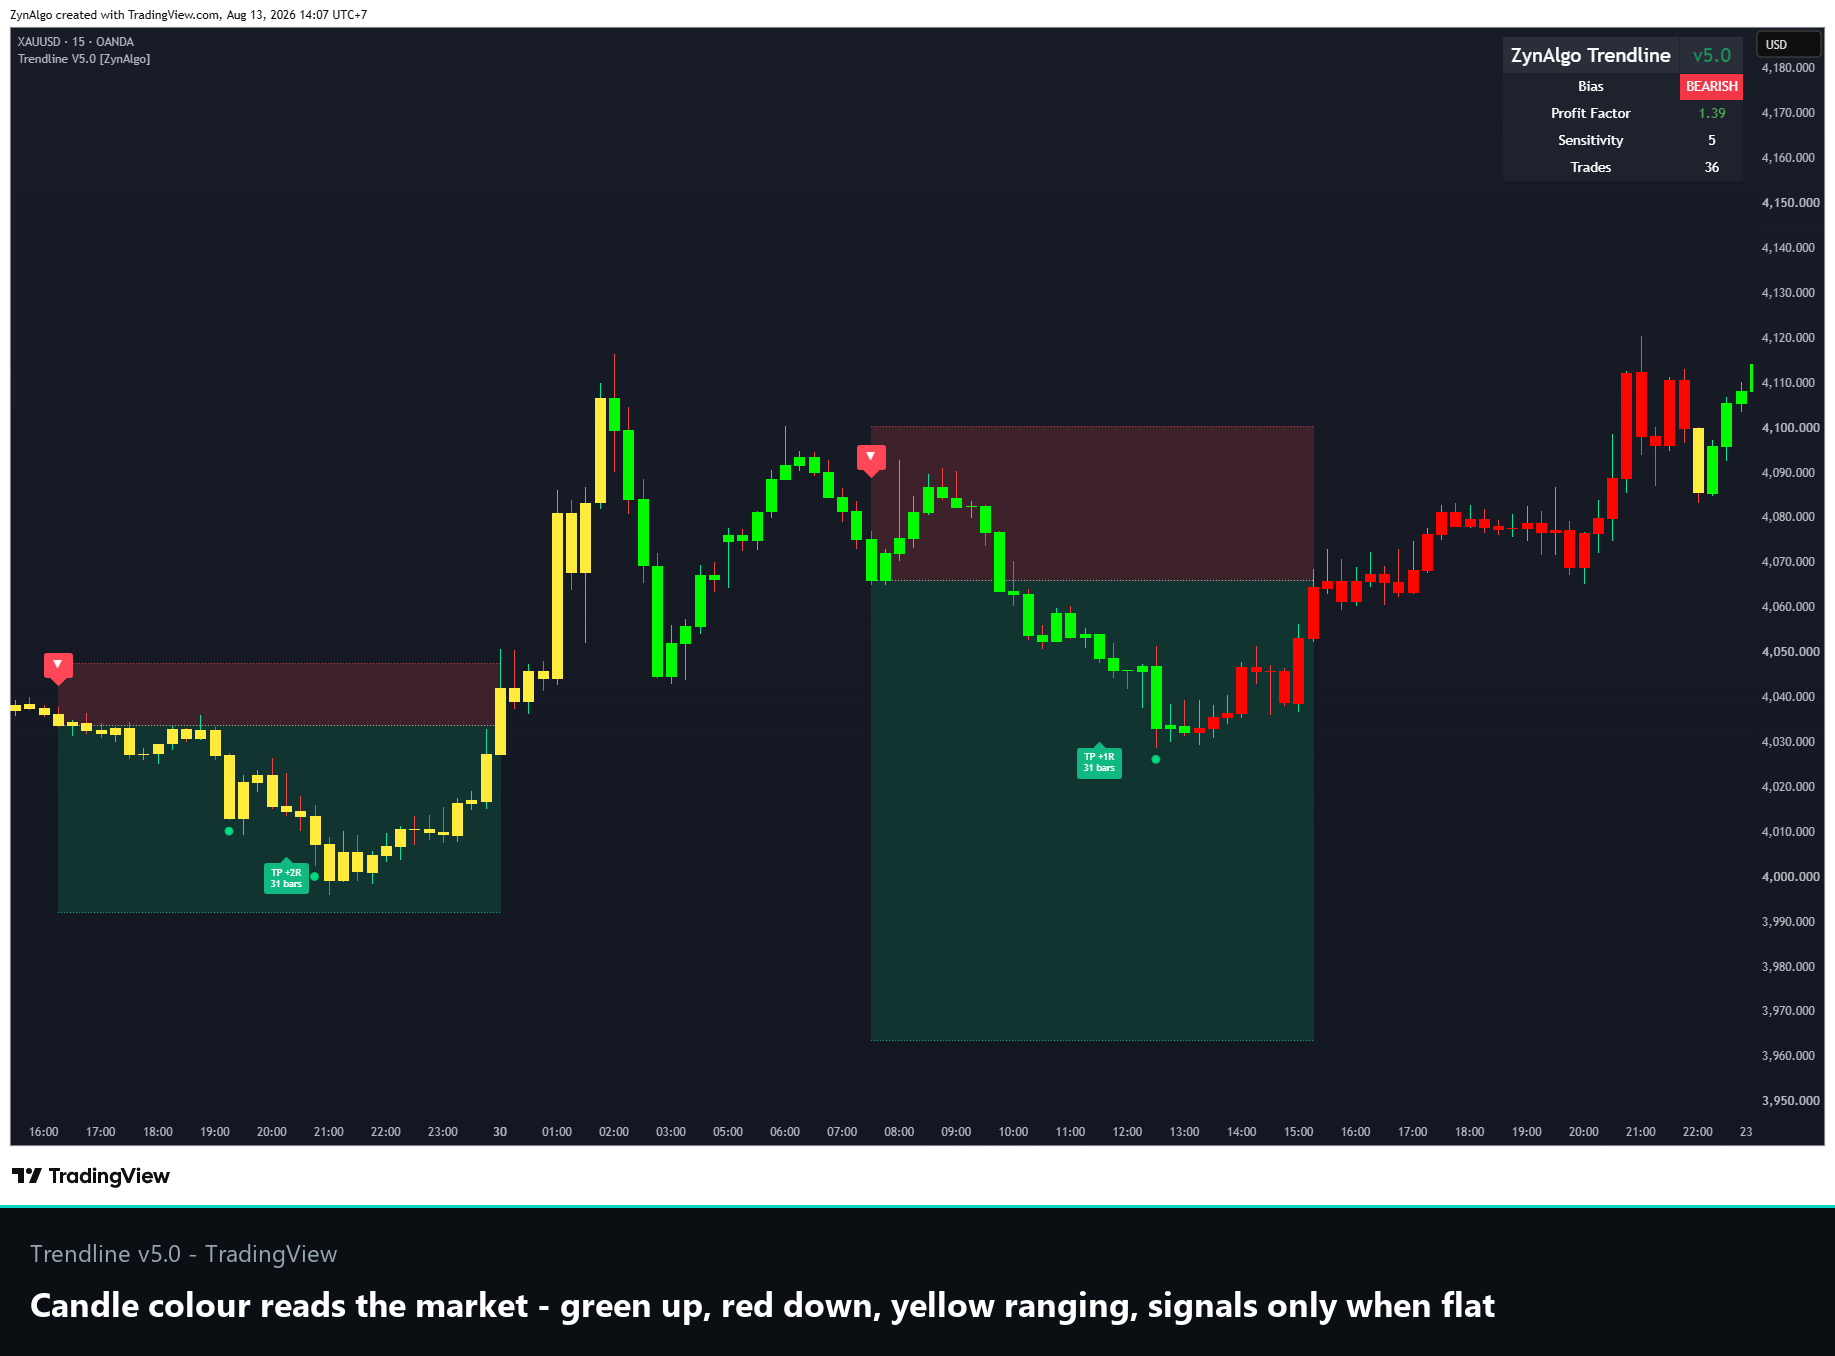
The stretch above moves through all three states - yellow while price ranges, green through the rally, red as it rolls over - and the SELL signals print only as the average flattens near a range high.
What it looks like on the chart:
- The Sentiment Range MA is never drawn as a line - it is expressed through candle colour, so the chart stays clean
- Rising average -> uptrend candles - falling average -> downtrend candles - flat average -> sideways candles
- The flat state is the one that matters: it marks stretches where price is rotating inside a range instead of advancing
- Candle colouring always comes from this Mode 4 average, even when you switch the indicator to Mode 1, 2 or 3
This is where a lot of traders go wrong. An oversold RSI reading feels like a buying opportunity in any market, so reversal signals get taken in the middle of a strong downtrend - where oversold simply means the trend is working. Trendline v5.0 removes that temptation by refusing to generate Mode 4 signals while the average is rising or falling.
How the Sentiment Range MA is defined
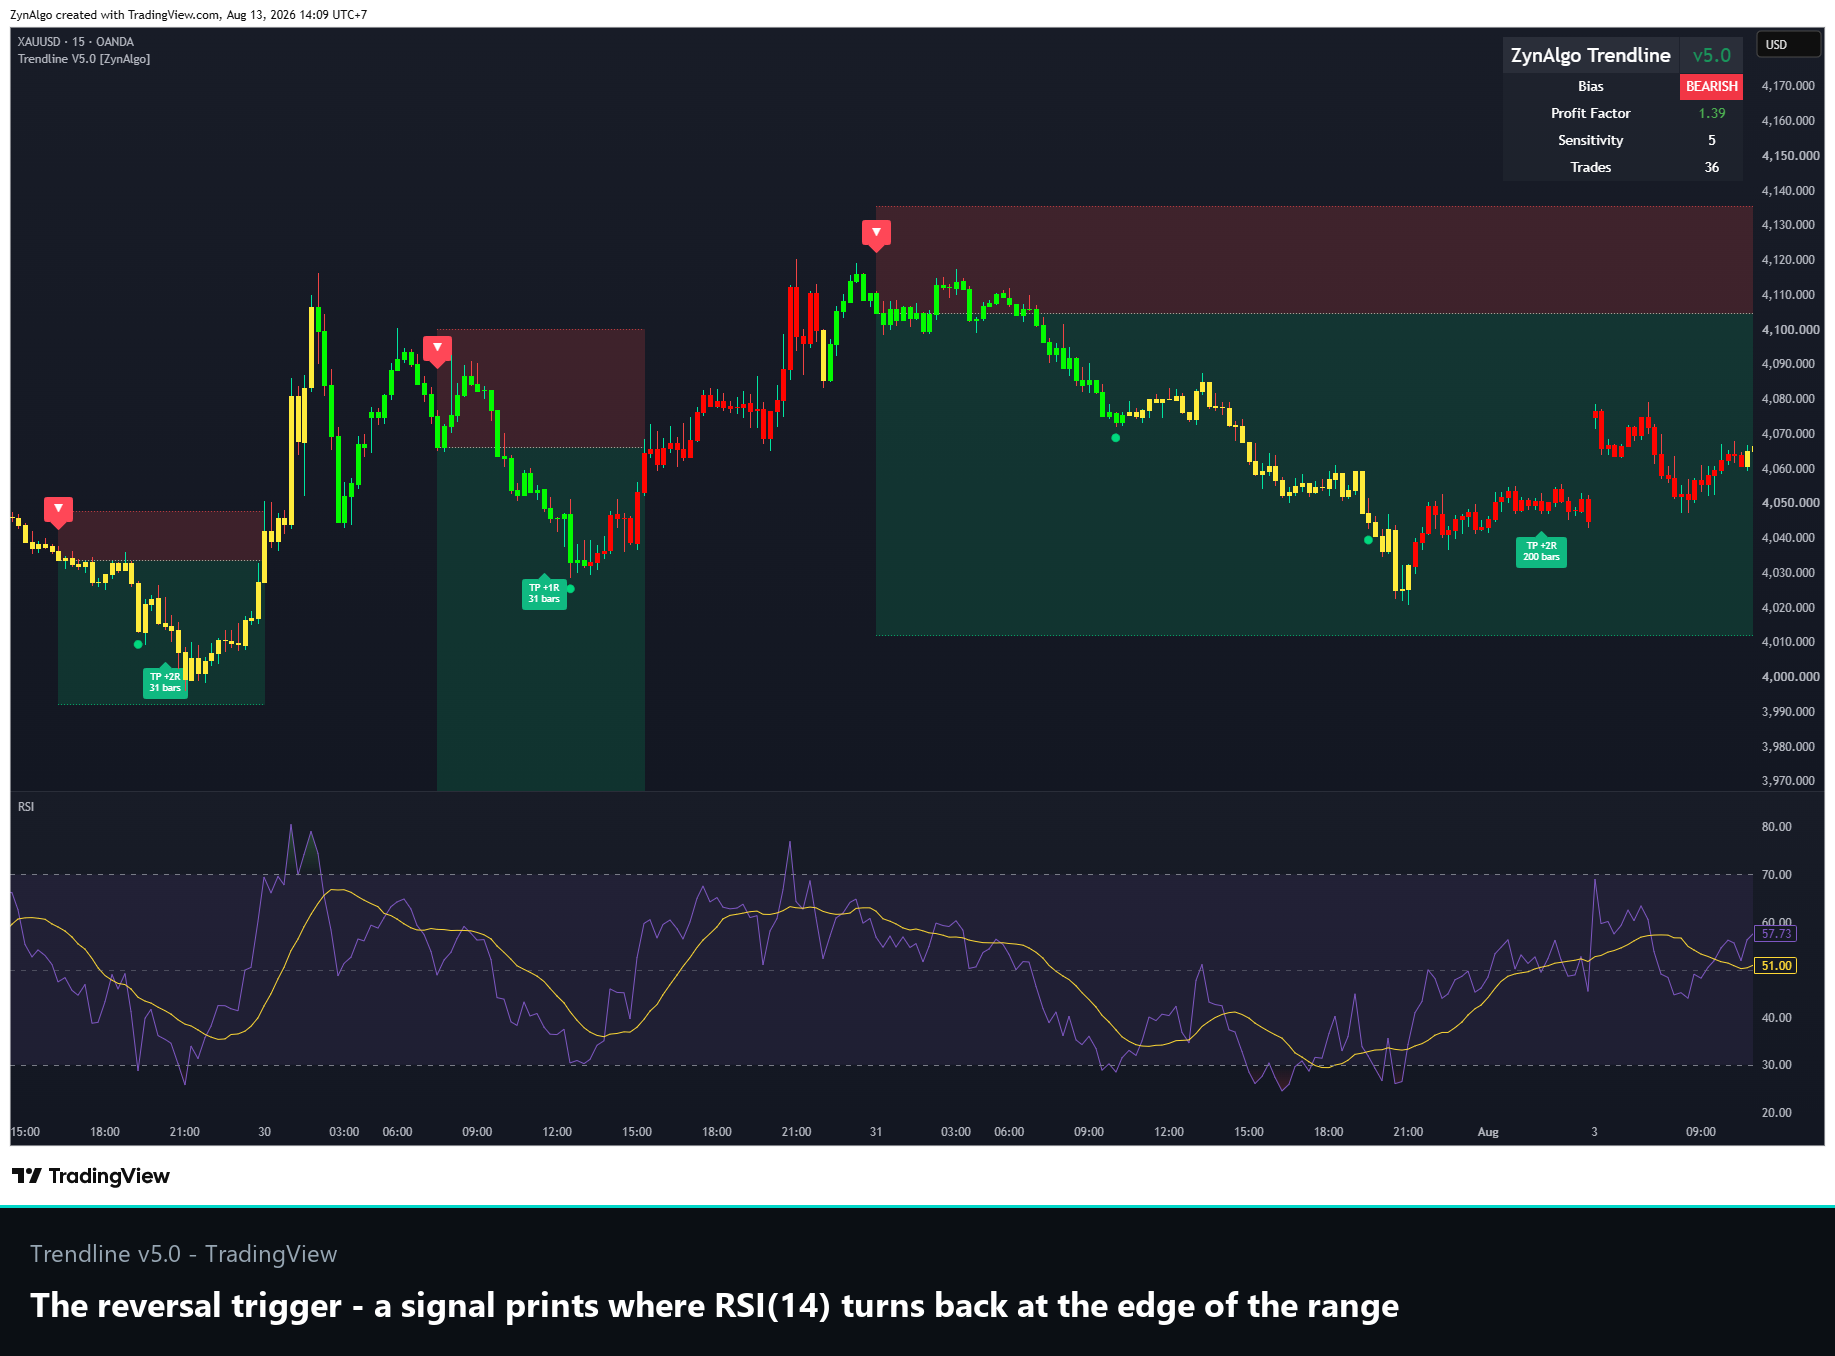
The lower panel above is RSI(14) - the reversal trigger from the list below. Read it together with the chart: signals appear where RSI turns back from an extreme while price is stretched to the edge of its range, which is exactly the condition the next section spells out.
The pieces that build it, and what each one contributes:
- Wick-based candle range (high to low), smoothed over 5 bars - establishes the top and bottom edge the average reacts to
- Band width = average candle range over 200 bars x 8 - sets how far price must travel before the average is allowed to move
- Stepped anchor - the average re-centres on close only when the smoothed top or bottom breaks outside the current band, which is what removes the noise
- Double smoothing (a 27-period weighted average applied on top of a simple average) - produces the final, gently curving output
- Slope test against a 0.001% threshold - converts that output into the three states: rising, falling, or flat
- RSI(14), shifted by the Sensitivity setting - supplies the actual reversal trigger once the flat state is confirmed
- 50-bar high-low range - provides the top and bottom zones that a signal must occur in
- ATR(14) - used only for stop distance and target spacing, not for signal logic
When trading opportunities appear
In the default Mode 4, a BUY is printed only when all of the following are true on the same bar:
- The previous bar's RSI closed below 32
- That RSI reading was lower than the reading two bars ago - momentum was still falling
- The current RSI has turned back up above the previous bar's value
- Price is sitting in the bottom 30% of the last 50 bars' range
- The Sentiment Range MA is flat (sideways candles)
- At least 10 bars have passed since the last BUY
A SELL is the exact mirror: previous RSI above 68, higher than two bars ago, current RSI turning back down, price in the top 30% of the 50-bar range, flat Sentiment Range MA, and 10 bars since the last SELL.
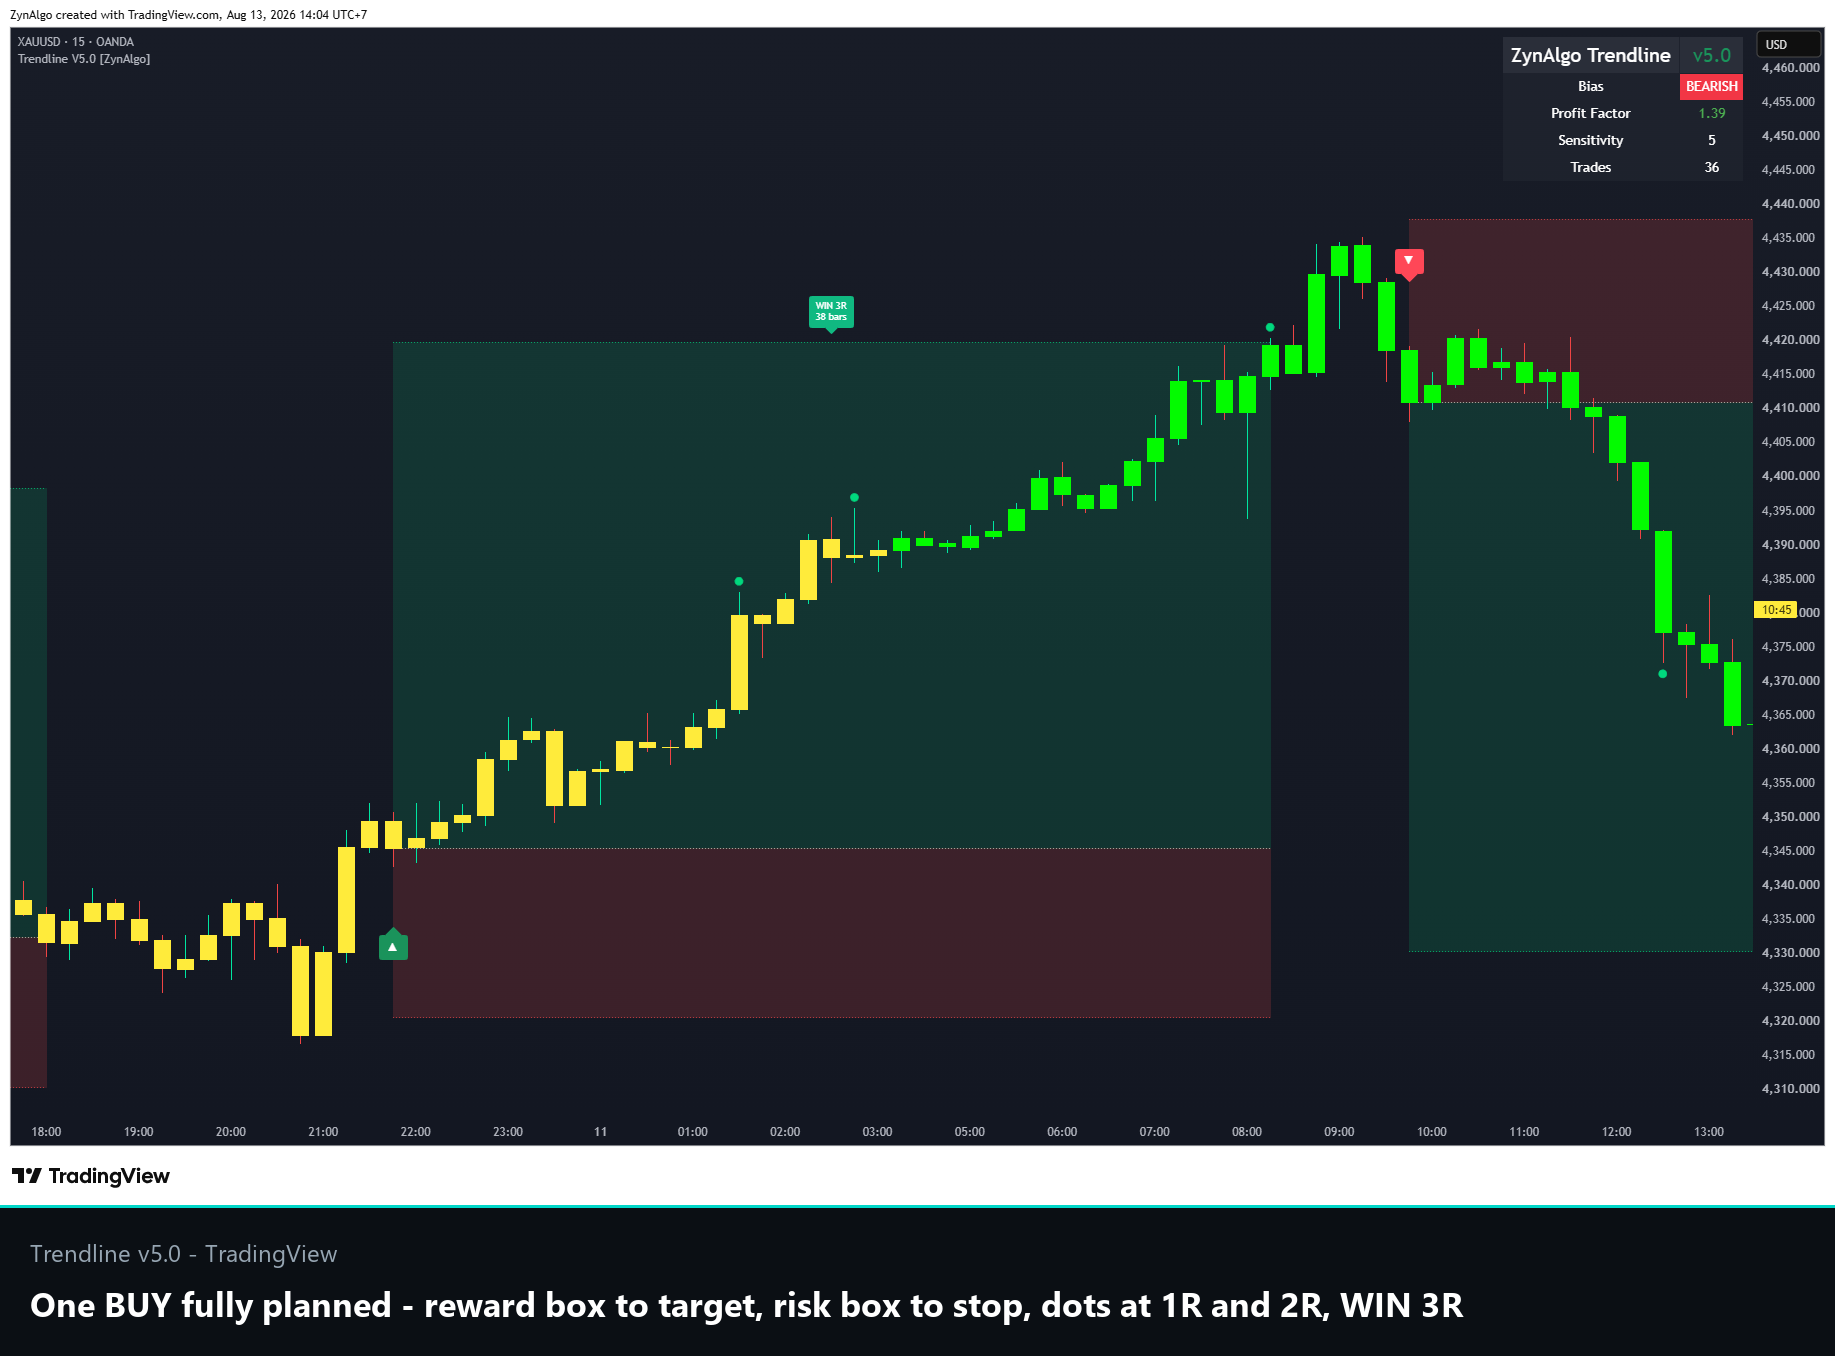
The example above is a textbook BUY. It fires at the green triangle below the bar; from there the red risk box drops to the ATR stop while the green reward box projects up to the target. As price advances it tags each interim milestone - a small green dot prints at 1R and again at 2R - before reaching the 3R target, at which point the box is stamped WIN 3R and notes that the move took 38 bars.
Every signal is drawn the same way. The entry is a green triangle below the bar for a BUY and a red triangle above the bar for a SELL, and the moment it fires Trendline v5.0 draws the full plan:
- Green reward box - from the Entry up (BUY) or down (SELL) to the active target, with a dotted target line
- Red risk box - from the Entry to the Stop Loss, with a dotted stop line, so the reward-to-risk is visible at a glance
- Dotted Entry line - the close of the signal bar
- Interim green dots - one prints each time an earlier target (1R, 2R) is reached while price keeps running your way
- Result label - when the trade closes the box is stamped WIN xR (target reached), TP +xR (closed in profit after a partial target) or SL -1R (stop hit), together with how many bars it took
- Red x - marks a clean stop-out where no target was reached first
Read the entry label together with the RSI turn and the candle colour that produced it - that is the reason the signal fired.
Before a raw signal becomes a printed one it still has to clear the shared filters:
- Cooldown - a further 10-bar gap is enforced after every printed signal, in every mode
- Stability Mode (on by default) - blocks any new signal while a trade is still open
- Smart Signal Filter (off by default) - forces signals to alternate, so a BUY cannot follow a BUY
- Session Filter (off by default) - when enabled, new signals are only allowed inside the server-time window you set (default 07:00-18:00), so the tool can sit out quiet or unwanted hours
- Follow Trend (off by default) - permits BUY only above the 200 EMA with RSI(14) over 50, and SELL only below it with RSI under 50. Note that switching this on works against Mode 4's mean-reversion character
- Multi-timeframe filter - applied to Modes 1-3 only; Mode 4 skips it because the Sentiment Range MA already performs that job
Every printed signal draws its own levels. Entry is the close of the signal bar. The stop sits ATR(14) x 2.8 away from entry (the Distance setting), and each target is a multiple of that risk: TP1 at 1R and enabled by default, TP2 at 4.5R and TP3 at 6.5R available but switched off. With TP2 or TP3 turned on, a breakeven stop activates once TP1 is reached. The projected box runs forward the number of bars set by TP/SL Box Width and shortens to the exact bar the trade closes. Any trade still open after 200 bars is closed out at the current price.
Is Trendline v5.0 right for you?
Trendline v5.0 suits you if you recognise yourself here:
- You trade ranges and reversals rather than chasing breakouts
- You work on intraday to swing timeframes - M15 through H4 is the natural home for the default settings
- You trade liquid instruments that spend real time going sideways: FX majors, gold, index CFDs, large-cap crypto
- You want a defined stop and target drawn on every signal instead of deciding levels in the moment
- You would rather wait for a handful of well-located setups than act on every oversold reading
If you are a pure trend-follower who wants to be in every move, the default mode will feel too quiet - start with Mode 1 or Mode 2 instead.
Trendline v5.0 is deliberately built to say no more often than it says yes. Its value is in the setups it filters out, not the number of arrows it prints.
Browse the ZynAlgo marketplace
Trading involves risk. Signals are analytical tools, not financial advice, and past behaviour does not predict future results.
- Trendline v1Aug 13, 2026