Phase Filter
A market-context tool that focuses on which phase the market is in, not noise. Phase Filter is a market phase filter for TradingView that reads every confirmed bar and tells you whether price is building, faking a break, trending or pulling back.
Key benefits
- Know the environment before you enter - one glance shows whether conditions favour a breakout, a continuation or standing aside.
- Spot failed breaks as they happen - the Fake Move phase flags a push beyond the recent range that closes back inside.
- Hold trends with more confidence - pullbacks are labelled as pauses, with a bar count for how long the phase has run.
- Judge conviction, not just direction - a 0-100 quality score and an ADX read show how strong the phase really is.
- Works on your chart, as-is - it follows the chart timeframe automatically, with no higher-timeframe setting to align.
How it works
It combines EMA trend location, ATR and Bollinger-width compression, ADX strength, a smoothed RSI momentum pair and pivot-based structure into one phase score, with a minimum dwell time so the label does not flicker. Full breakdown is in the Manual.
What's included
TradingView indicator (Pine Script v6), invite-only access, phase labels, HUD dashboard, optional early-warning and market-structure layers, plus the Manual.
Best for
Forex, metals, indices and crypto on intraday and swing timeframes - for traders who already have an entry method and need a context filter around it.
Get started
Browse the ZynAlgo marketplace
Trading involves risk; this is an analysis tool, not a guarantee of results.
Phase Filter
Understanding Phase Filter
Phase Filter is a market-context indicator for TradingView. It is not an entry system and it does not print buy or sell signals. It answers a single question: what phase is the market in right now?
The indicator runs in a separate pane below price and classifies every confirmed bar into one of five phases - Building Zone, Fake Move, Strong Trend Up, Strong Trend Down, and Pullback. To do that it reads trend location through a 21/55 EMA pair, volatility through ATR(14) measured against its own 80-period average, trend strength through ADX(14), momentum through RSI(14) smoothed into a fast (EMA 8) and a slow (EMA 21) line, range compression through Bollinger Band width against its 80-period average, breaks and sweeps of the last 24 bars' high and low, and swing structure through pivot-based break-of-structure and change-of-character detection.
The result is one stable read of context on your TradingView chart, on whatever symbol and timeframe you already trade - so you can judge whether the environment suits your own method before you act.
Market Phase explained
A market phase is the behaviour regime price is currently in. The same candle pattern means very different things depending on whether the market is compressing, faking a break, expanding directionally, or simply resting inside an existing move. Phase Filter makes that regime explicit instead of leaving it to feel.
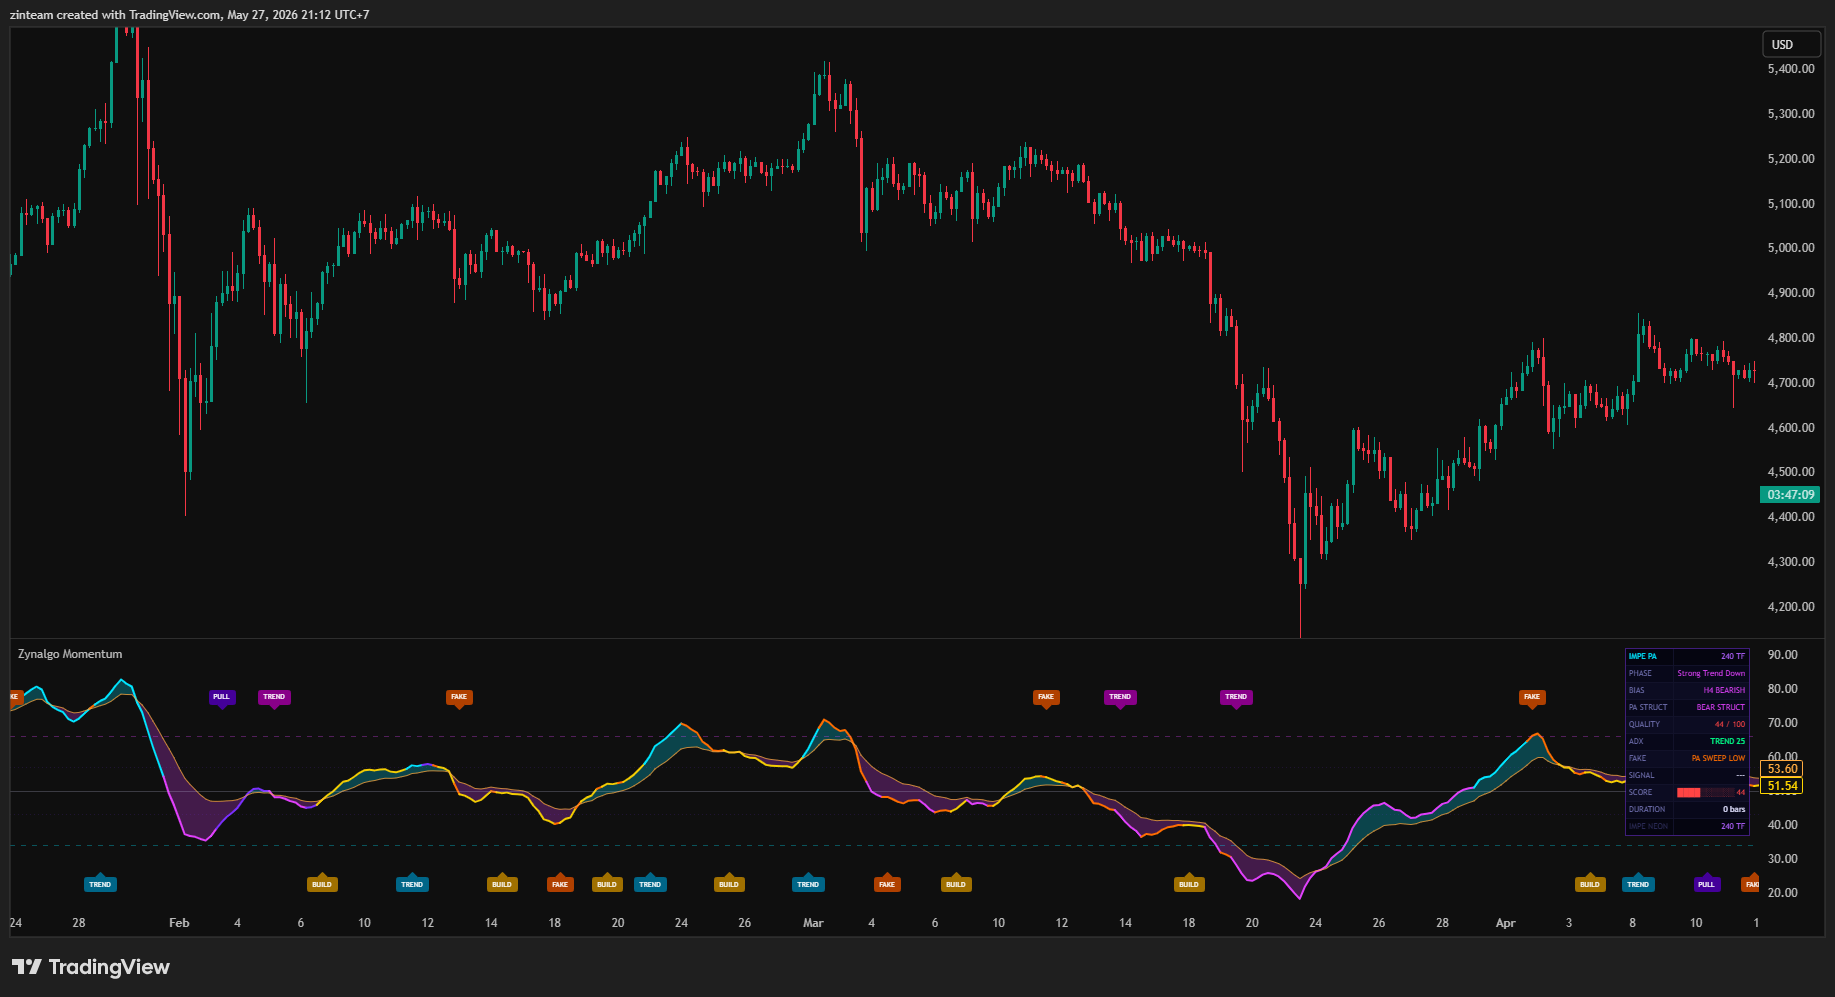
The five phases behave as follows:
- Building Zone - volatility contracts, ADX is weak, the fast RSI hovers around the middle band, and price stays inside the recent range. Energy is being stored, not released.
- Fake Move - price pushes beyond the 24-bar range high or low and then closes back inside it, or a structure break fails. The move looked real and was not.
- Strong Trend Up / Strong Trend Down - a range break or a wide-bodied candle arrives together with expanding volatility, rising ADX and momentum pushing in the same direction.
- Pullback - momentum fades while price holds its side of the slow EMA. The trend is pausing, not necessarily reversing.
This is exactly where two common mistakes happen. Traders take a breakout the moment price pierces a range boundary - which is precisely the Fake Move pattern. And traders exit or reverse on the first fade of momentum inside a strong trend - which is usually just a Pullback. Both mistakes come from reading a single candle without knowing the phase around it.
How a market phase is defined
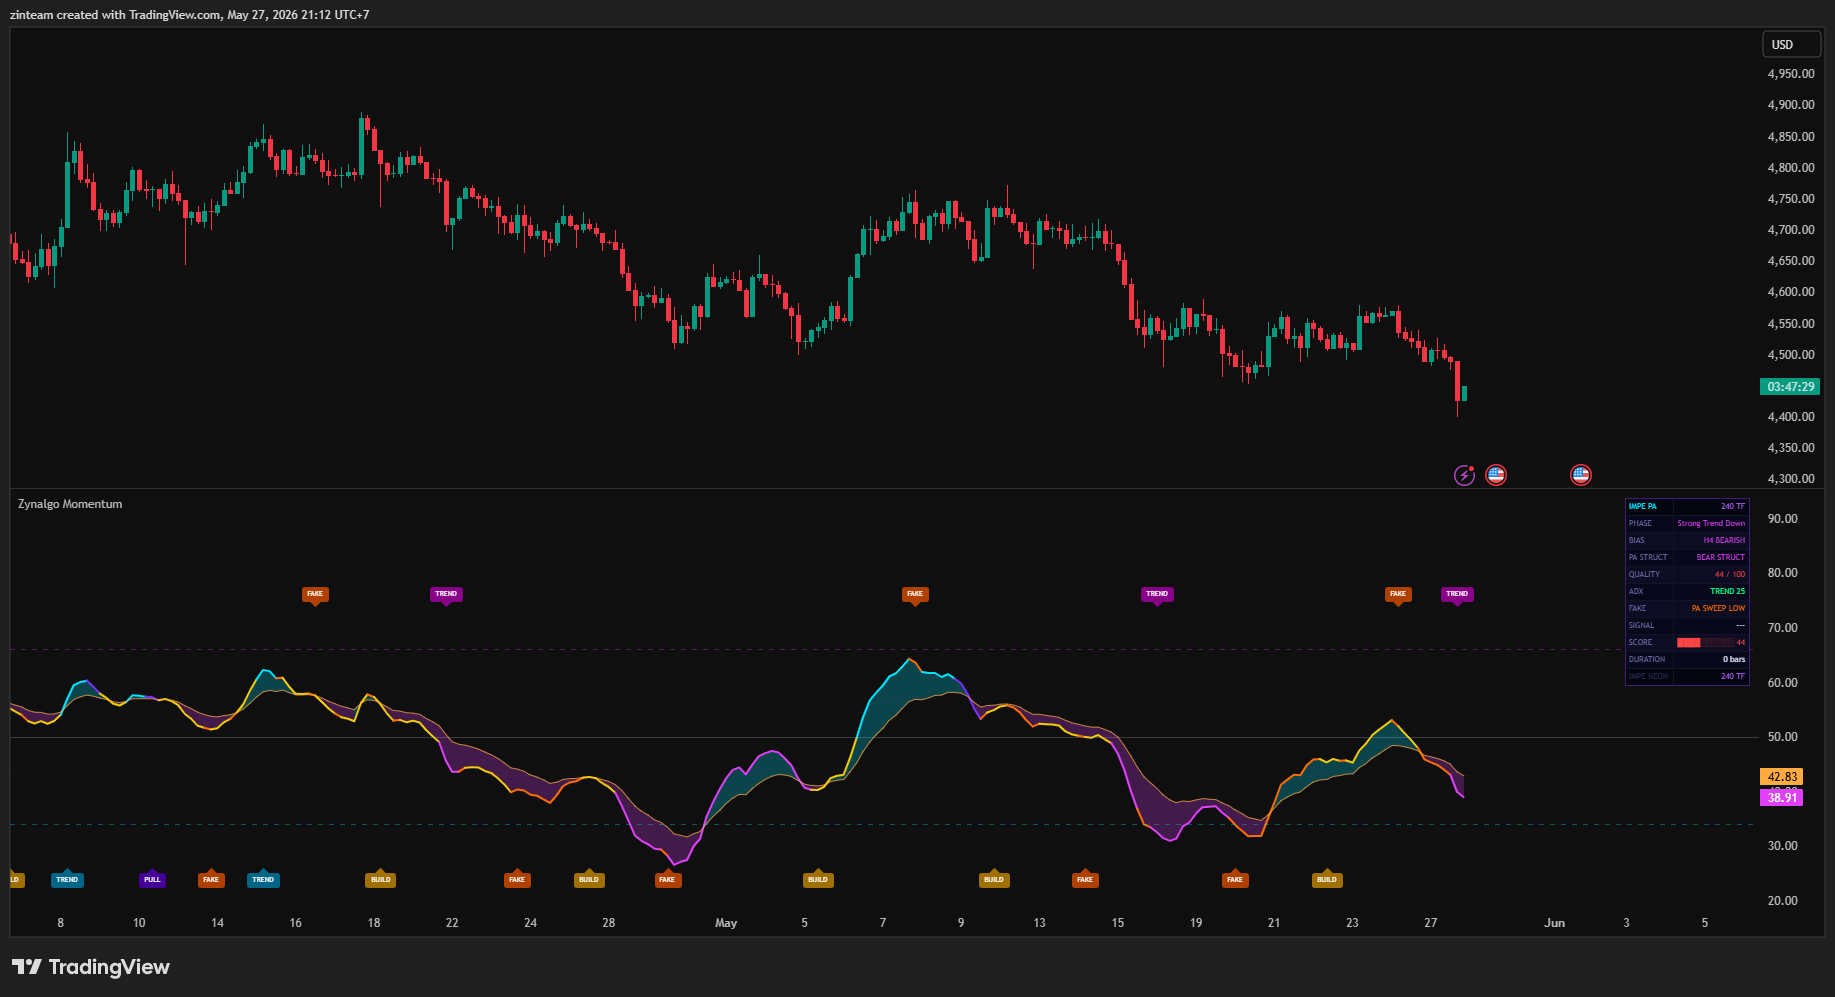
Each phase is scored from several independent components, so no single reading can force a phase change on its own:
- EMA 21 and EMA 55 - locate price relative to fast and slow trend reference.
- ATR(14) against its 80-period average - flags contraction below 0.82x and expansion above 1.03x.
- Bollinger Band width (20) against its 80-period average - flags a squeeze below 0.85x.
- ADX(14) - weak below 17, trending above 21; whether it is rising also counts.
- RSI(14) smoothed into a fast EMA(8) and a slow EMA(21) - their difference forms the momentum histogram used to detect expansion, fading and decay.
- The highest high and lowest low of the last 24 bars - sources the range break and the sweep (wick beyond, close back inside).
- Pivot swing structure (5 bars each side) - detects break of structure, change of character and failed breaks, adding or subtracting up to 15 points from the directional score.
- Scoring thresholds - a Building Zone needs a score of at least 62, an expansion at least 55.
On top of the score, every phase must last a minimum number of bars before it can change (3 bars for Building Zone, 1 for Fake Move, 3 for a trend, 2 for a Pullback) and the switch condition must hold on a confirmed bar close. That dwell requirement is what keeps the phase label from flickering back and forth on noise.
Reading the signals
Phase Filter is a filter. There are no entry arrows, no stop levels and no targets - what it gives you is the state of the market and how confident it is in that state.
On the pane you will see:
- Phase labels - a single label printed when the phase actually changes: BUILD (Building Zone), FAKE (Fake Move), TREND (Strong Trend Up or Down) and PULL (Pullback). Bullish-context labels print low in the pane, bearish-context labels print high, and a cooldown of 8 bars prevents label spam.
- The momentum wave - the fast RSI line plotted against the slow RSI line, with the area between them filled cyan while the fast line is above and magenta while it is below. The fast line also takes the colour of the active phase.
- Reference levels - 50 as the midline, 66 and 34 as overbought and oversold, 43 and 57 marking the equilibrium band the Building Zone logic uses.
- The HUD table, top right, updated on the last bar: PHASE (phase name), BIAS (directional read such as PULLBACK UP or SWEEP HIGH), PA STRUCT (BOS / CHoCH / structure context), QUALITY (the active phase score out of 100), ADX (weak / trend / strong plus the value), FAKE (whether a sweep is active), SIGNAL (the current early-warning state), SCORE (the same score drawn as a bar) and DURATION (how many bars the phase has lasted).
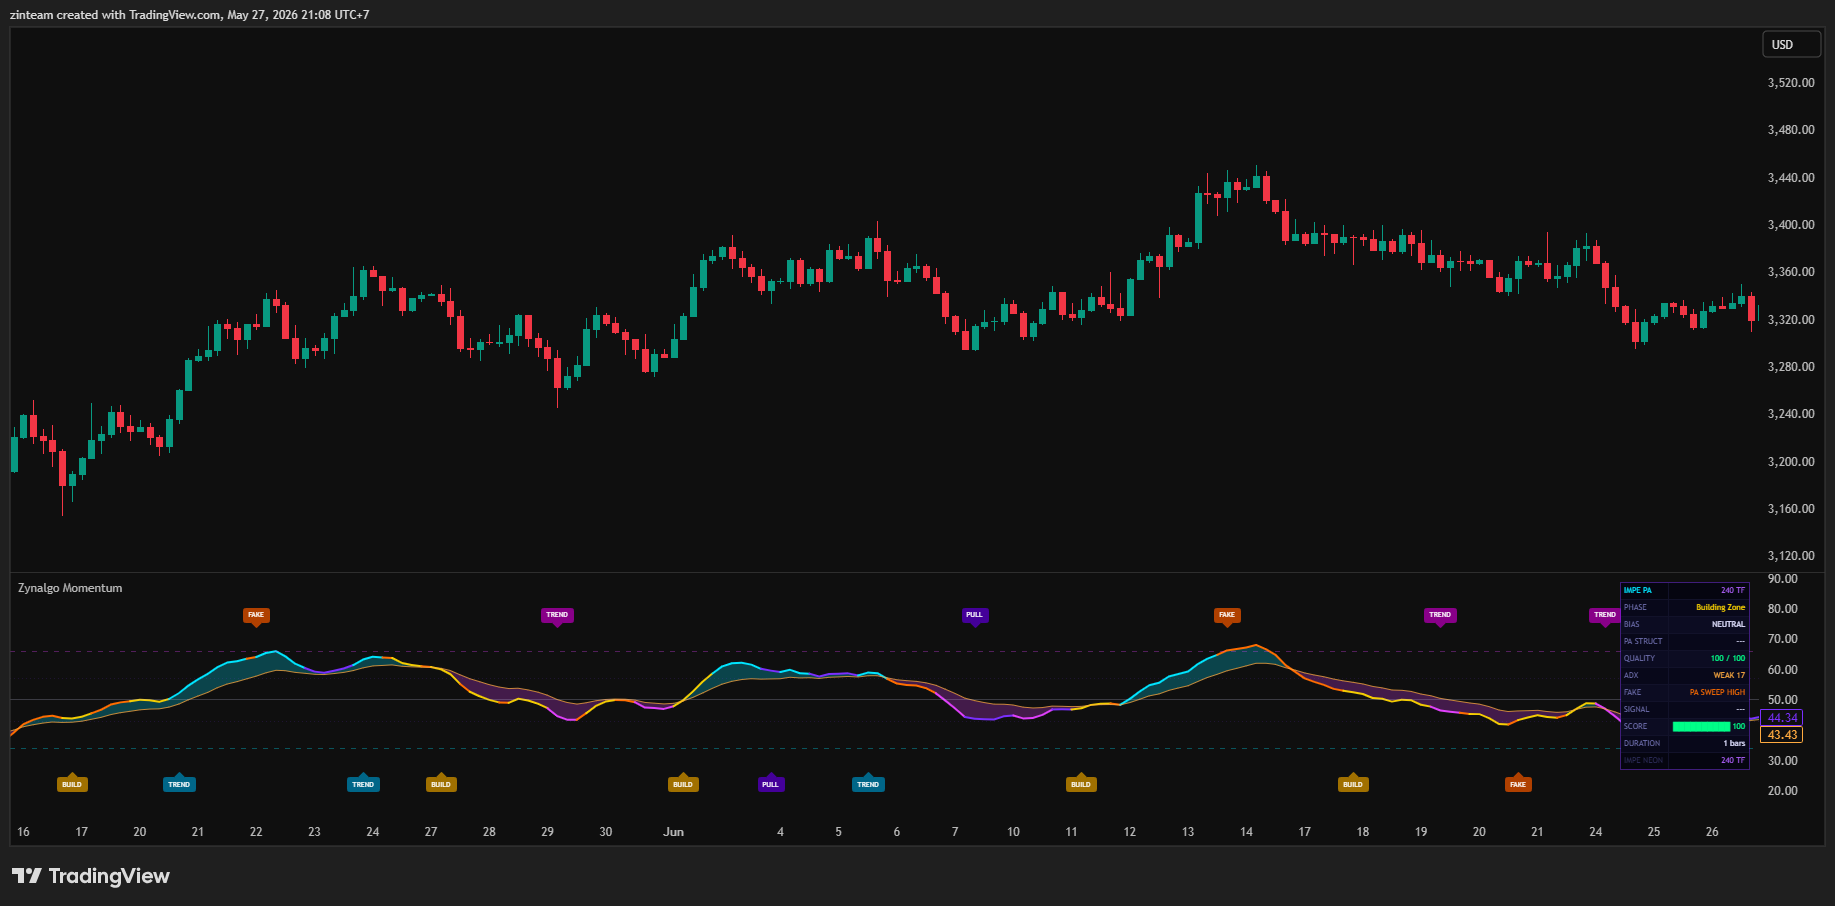
How to act on each phase is your decision, but the intent of each one is clear:
- BUILD - the market is compressing. This is preparation time: define the range boundaries and wait rather than trade inside the noise.
- FAKE - a break has just failed. Chasing the break here is what the phase is warning against; the sweep direction is shown in the BIAS and FAKE rows.
- TREND - expansion is confirmed in one direction. This is where trend-following and continuation methods are in their element, and BIAS tells you which side.
- PULL - momentum is fading inside an existing trend. Treat it as a pause and watch for resumption rather than assuming a reversal; DURATION tells you how long it has run.
Two optional layers add earlier context, both switched off by default. Early Warning plots triangles when momentum curls out of a Building Zone, an X-cross when a trend shows exhaustion (a sweep, a failed break, a divergence or an overbought/oversold fast RSI together with fading momentum), and circles when a Pullback starts curling back toward the trend direction. PA Struct plots circles for break of structure and diamonds for change of character. Neither is an entry instruction - they mark conditions that often precede the next phase change.
Phase Filter describes market context. It does not predict outcomes and no phase reading guarantees any result. Always apply your own risk management.
Who benefits most from Phase Filter
- Traders who already have an entry method and keep losing on good setups taken in the wrong environment.
- Breakout traders who want a visible warning that a break has failed instead of learning it from the drawdown.
- Trend traders who need to tell a pause apart from a turn, and want a duration count while they hold.
- Intraday and swing traders on any symbol and any timeframe - the indicator reads the chart timeframe automatically, with no manual timeframe setting to align.
- Discretionary traders who want the market read as a state rather than as a stream of unrelated candles.
Knowing which phase you are in will not increase the number of trades you take. It should reduce it - and that is the point: fewer trades taken in conditions that never suited your method.
- Phase Filter v1Aug 13, 2026
Why Good Setups Fail: Trading the Wrong Phase
When a perfect pattern leads to a losing trade, the problem often isn't your entry, it's the market phase you took it in. Learn how to identify whether the environment actually suits your method before you risk capital.
Why My Breakouts Fail After the Break: Understanding Market Phase
You see the range break, you take the trade, and then price reverses back inside. That pattern has a name, and a filter that reads it before you commit.