
Volume Deviation Bands
Price being far from average is not information on its own. Volume Deviation Bands [ZynAlgo] measures that distance against the volume-weighted mean price and the spread the volume itself has been trading around, so a stretch only registers when the participation behind it says it should.
Key benefits
- A distance that respects volume - the centre line is a volume-weighted mean price, and the unit of measurement is the volume-weighted deviation around it, not a fixed percentage.
- Zones that move with the market - the midline is an average of the oscillator itself and the bands sit at its own standard deviation, so the thresholds re-scale instead of staying fixed.
- Two gates on every signal - a band breakout only counts when price is also on the correct side of the Zyn-VWAP baseline drawn on your price chart.
- Shock candles - bars are recoloured when the reading is beyond a band and the trend state agrees, so stretched conditions are visible without reading the pane.
How it works
A rolling volume profile builds a volume-weighted mean price and the mean deviation around it. The oscillator expresses where price sits in that deviation, smoothed, then compared with an adaptive midline and bands set at its own standard deviation. Full walkthrough in the Manual.
What's included / Platforms
- TradingView indicator, Pine Script v6, added to your TradingView username once access is granted. Released to ZynAlgo VIP members.
Best for
Intraday traders on volume-bearing markets - futures, indices, gold and crypto - who fade or follow stretched conditions and want the stretch measured against participation rather than a fixed band.
Get started
Browse the ZynAlgo marketplace
Disclaimer: an analysis tool, not financial advice or a signal service. Readings and markers are context only, and no indicator removes market risk - trade with your own plan and position sizing.
Volume Deviation Bands
Measuring distance in the market's own units
Most stretch indicators answer "how far is price from an average" with a fixed number - a percentage, a multiple of ATR, a band width someone picked. Volume Deviation Bands starts from a different place: it asks how far price is from the mean price the volume actually traded around, and then measures that distance in units of the deviation the volume itself has been showing.
The result is a reading that means the same thing in a quiet session and a violent one, because both the centre and the ruler are rebuilt from the volume on the chart.
Two things are drawn for you:
- On the price chart - the Zyn-VWAP baseline, the volume-weighted mean price the whole calculation is anchored to.
- In a separate pane - the deviation reading itself, its adaptive midline, and the gradient zones marking stretched territory.
Nothing is fitted to a market: the profile rebuilds itself from the last 50 bars and refreshes on a 10-bar cycle.
How the centre and the ruler are built
The pane is not a rescaled volume histogram. It is a distance measurement, and both halves of that measurement come from the same rolling profile.
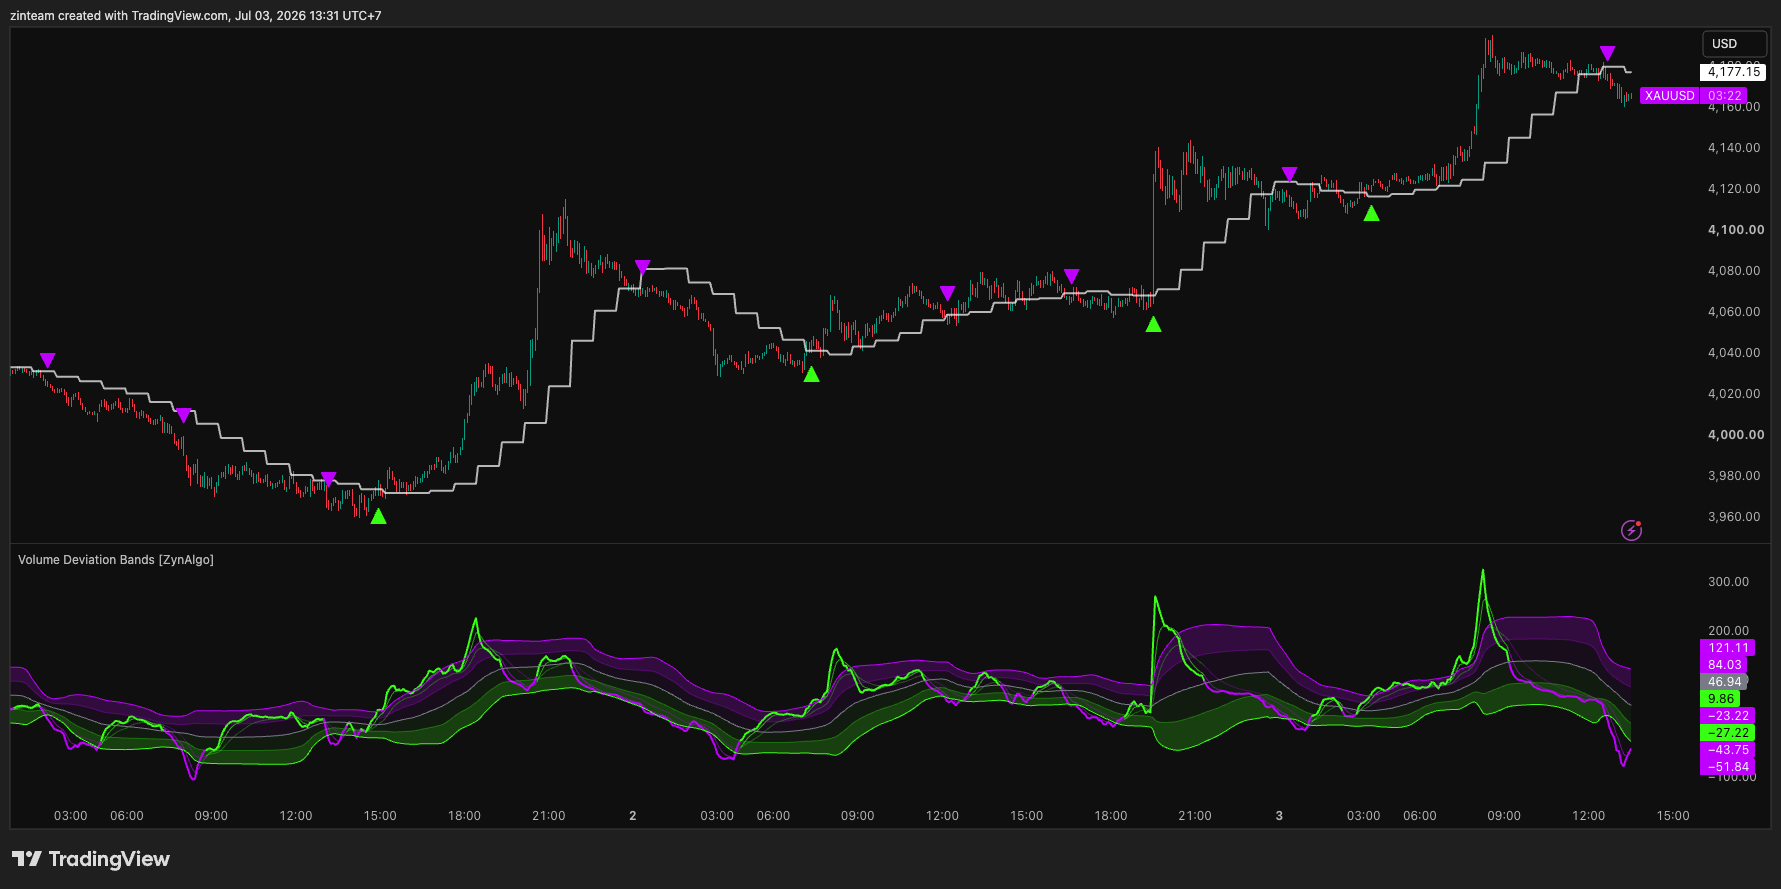
- The profile collects price and volume over a 50-bar lookback and rebuilds every 10 bars, which keeps the reference recent without redrawing it on every candle.
- From it comes the volume-weighted mean price - the Zyn-VWAP baseline, plotted on the price chart as a stepped line.
- From it also comes the volume-weighted mean deviation: the average distance between price and that mean, weighted by the volume traded at each price.
- The oscillator is simply where price sits relative to the mean, expressed in those deviation units and centred at 50, then smoothed.
The stepped look of the baseline is deliberate. It is not a bar-by-bar VWAP; it is the mean of a profile that refreshes on its own cycle, so it holds a level and then re-anchors.
How the zones decide what counts as stretched
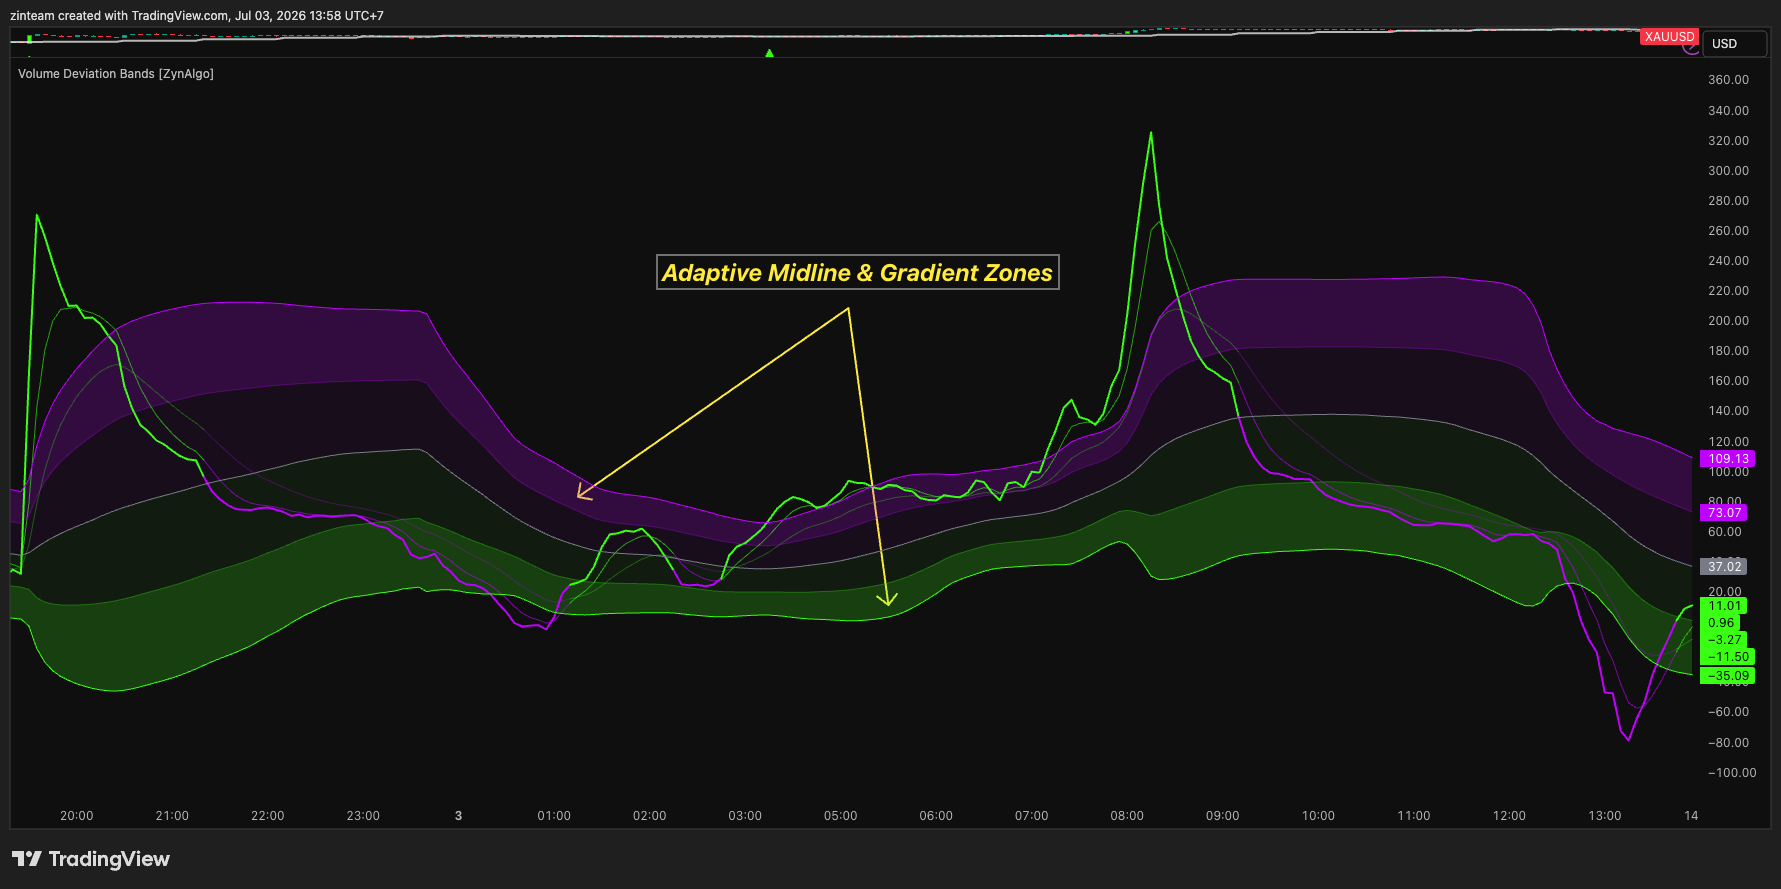
- The midline is a 50-period average of the reading itself, so the neutral point drifts with the instrument instead of sitting at a hard-coded value.
- The zones sit 1.5 standard deviations of the reading either side of that midline, again over 50 periods.
- Colour comes from a fast and slow pair on the reading - a 5-period against a 15-period - plus whether the reading is above the midline.
- When the reading is past a zone and the colour agrees, the candles themselves are recoloured, so a stretched state is visible without looking down.
Reading a signal
A breakout of the zone alone is not enough. The signal also has to agree with where price sits against the Zyn-VWAP baseline.
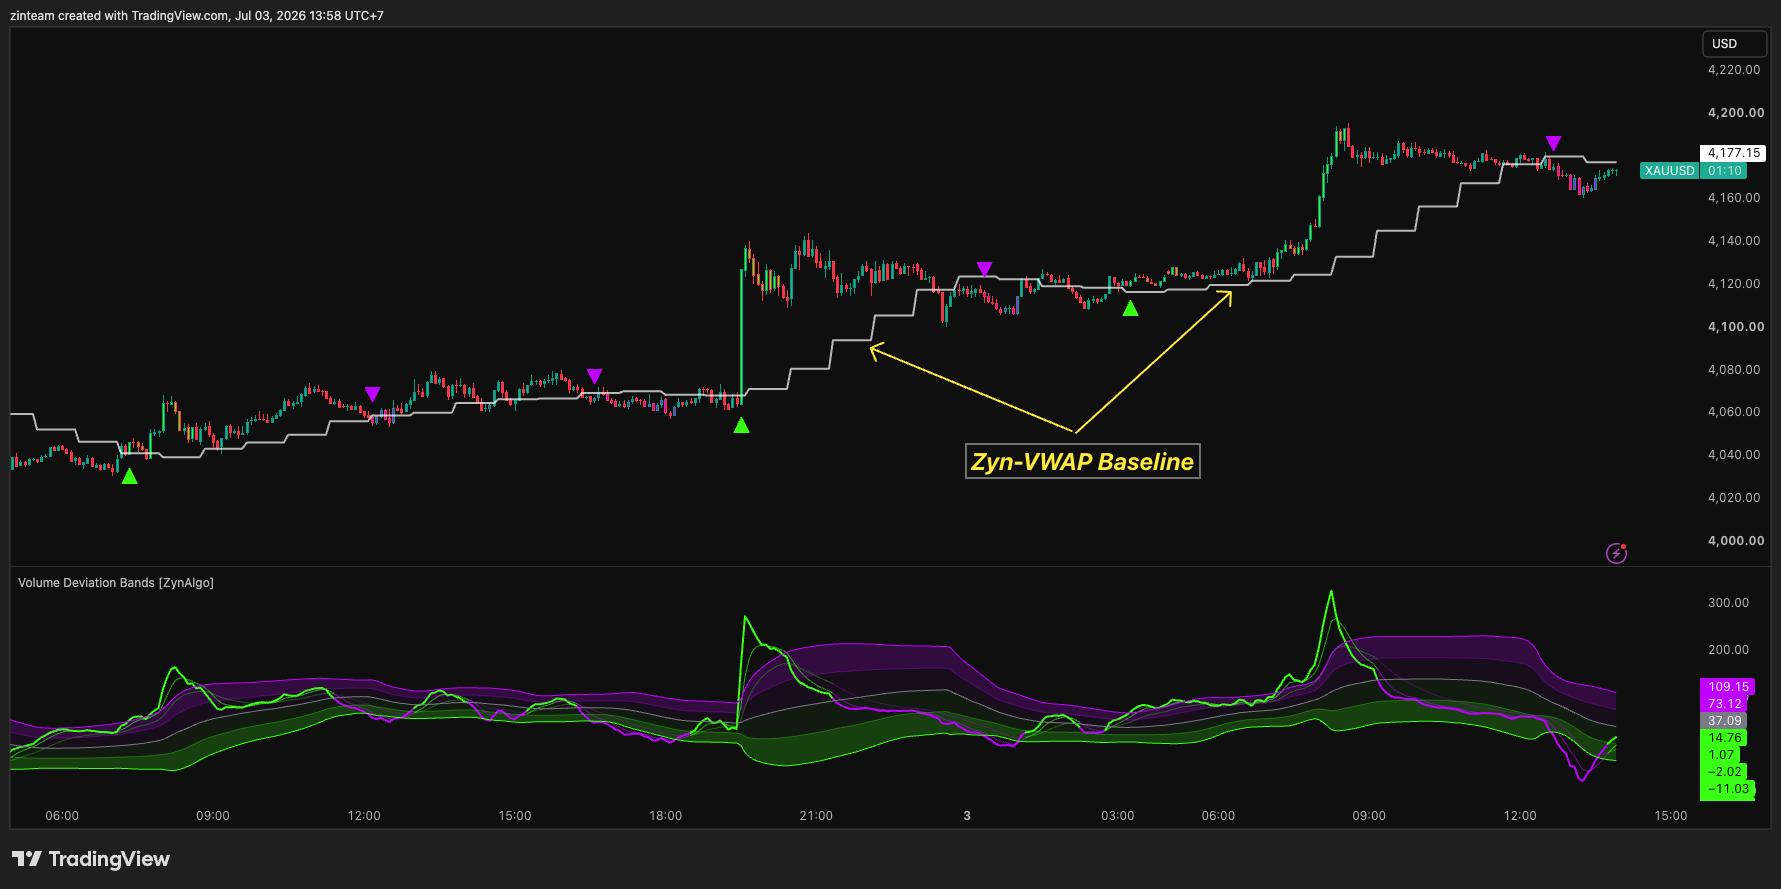
A buy triangle prints below the bar when the reading crosses above the upper zone and price is above the Zyn-VWAP baseline. A sell triangle prints above the bar on the mirror condition - the reading crossing below the lower zone with price under the baseline.
- The two conditions are deliberately opposed: the reading crossing out of the upper zone is a stretch, and the baseline test is what decides whether that stretch is being carried by the trend or fought by it.
- A 15-bar spacing rule applies per direction, so a reading that hovers around a zone edge produces one marker rather than a cluster.
- Markers are drawn on the price chart, not in the pane, so the pane stays readable.
Read the markers as the moment two independent readings agreed, not as an instruction. The tool measures participation and distance; the decision about entry, invalidation and size is yours.
Best suited for
It fits you if:
- You trade instruments where volume is meaningful - futures, indices, gold, crypto - rather than thin or synthetic symbols.
- You already work with VWAP or mean-reversion ideas and want the mean and the band to come from the same volume profile.
- You want to see stretched conditions on the candles themselves as well as in a pane.
Settings are grouped into four short blocks - volume analysis, oscillator, thresholds, and the interface - and the defaults are the ones described throughout this manual. The one worth adjusting first is sensitivity, which scales how far the reading travels for a given distance from the mean.
It fits you less if you trade instruments with unreliable volume. The whole measurement is built from volume; where the feed is poor, the reading loses its meaning before the chart shows it.
Browse the ZynAlgo marketplace
Disclaimer: an analysis tool, not financial advice or a signal service. Readings and markers are context only, and no indicator removes market risk - trade with your own plan and position sizing.
- Volume Deviation Bands [ZynAlgo] v1Aug 13, 2026





