Nexus Flow
ZynAlgo Nexus Flow turns messy stop-hunt candles into a scored, rule-based sweep setup on TradingView. It is a liquidity sweep indicator that waits for price to take out a recent pivot, fail, and close back inside.
Key benefits
- One setup, judged the same way - no competing patterns to choose between - a single event, with a score attached to it.
- Fewer marginal entries - volume must beat its own average, and ranked signals must reach 60 before printing.
- Volume context - a liquidity profile marks the Point of Control; setups near it rate higher.
- Levels drawn for you - entry, an ATR-based stop and up to three R:R targets arrive with the signal.
- Noise controls - Stability Mode and Smart Signal Filter limit how often signals pass.
How it works
Nexus Flow tracks recent pivots, waits for a bar to sweep one and close back on the other side with above-average volume, then scores it on penetration, reclaim strength, POC distance and volume. Full walkthrough in the Manual on the product page.
What's included
- TradingView indicator - added to your username, no file to install.
- Adjustable signal engine, liquidity profile, filters and TP/SL settings.
- BUY/SELL alerts with JSON payloads for automation.
- Full Manual with setup and execution walkthrough.
Best for
Best for liquid instruments with reliable volume data, intraday to swing timeframes, and traders who work from structure and stop hunts rather than trend continuation.
Get started
Browse the ZynAlgo marketplace
Trading involves risk; this is an analysis tool and no result is guaranteed.
Nexus Flow
1. How Nexus Flow approaches liquidity sweep setups
ZynAlgo Nexus Flow is built around one specific market event: the moment price pushes beyond a recent swing point, fails there, and closes back on the side it came from. Rather than scanning for many unrelated patterns, the indicator waits for that single sequence and then decides whether it deserves attention.
Three layers of data are involved in that decision. Pivot structure supplies the swing highs and lows that price is allowed to sweep. Volume is compared against its own moving average, so a sweep on thin participation is discarded. A liquidity profile built from recent history produces a Point of Control (POC), the most prominent volume area, which is used to reward signals that occur near it.
On TradingView the outcome is a chart that marks each sweep-and-reclaim event, prints a numeric score next to it, and draws the Entry, Stop Loss and Take Profit levels that belong to that event - so the same setup is read the same way every time.
2. Understanding the Liquidity Sweep and Reclaim
A liquidity sweep is the moment price trades through a level where orders are resting - the low under a recent swing low, the high above a recent swing high - and then fails to hold there. When the bar closes back inside the prior range, the break did not stand. That failure, not the break itself, is the event Nexus Flow is looking for.
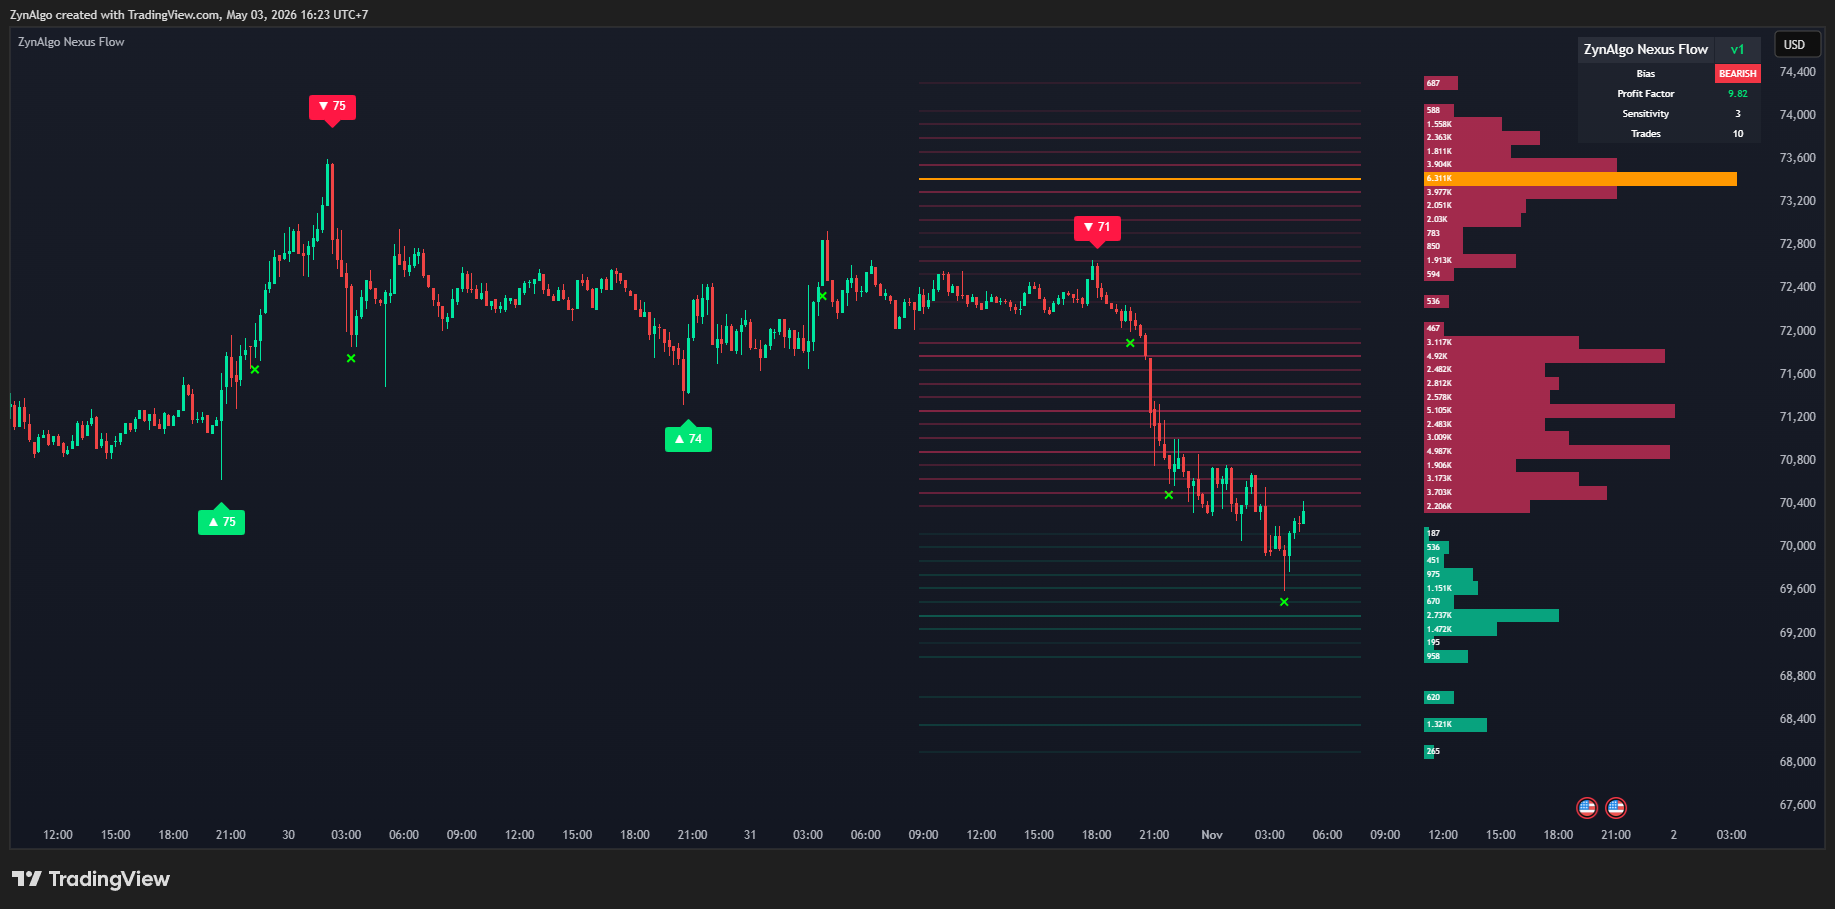
What the event looks like on the chart:
- Price trades beyond the most recent pivot - the level is taken out during the bar.
- The same bar closes back on the original side of that pivot.
- The direction of the close agrees with the reclaim: a bullish candle after a downward sweep, a bearish candle after an upward sweep.
- Volume on that bar is above its own moving average.
The common mistake here is reacting to the break. A move through a swing low looks like a breakdown while it is happening, and traders position in the direction of the break at exactly the point where the move is being faded. Nexus Flow does not evaluate the break at all - nothing is printed until the bar has closed, and only a bar that closes back inside qualifies.
How the sweep and reclaim is defined
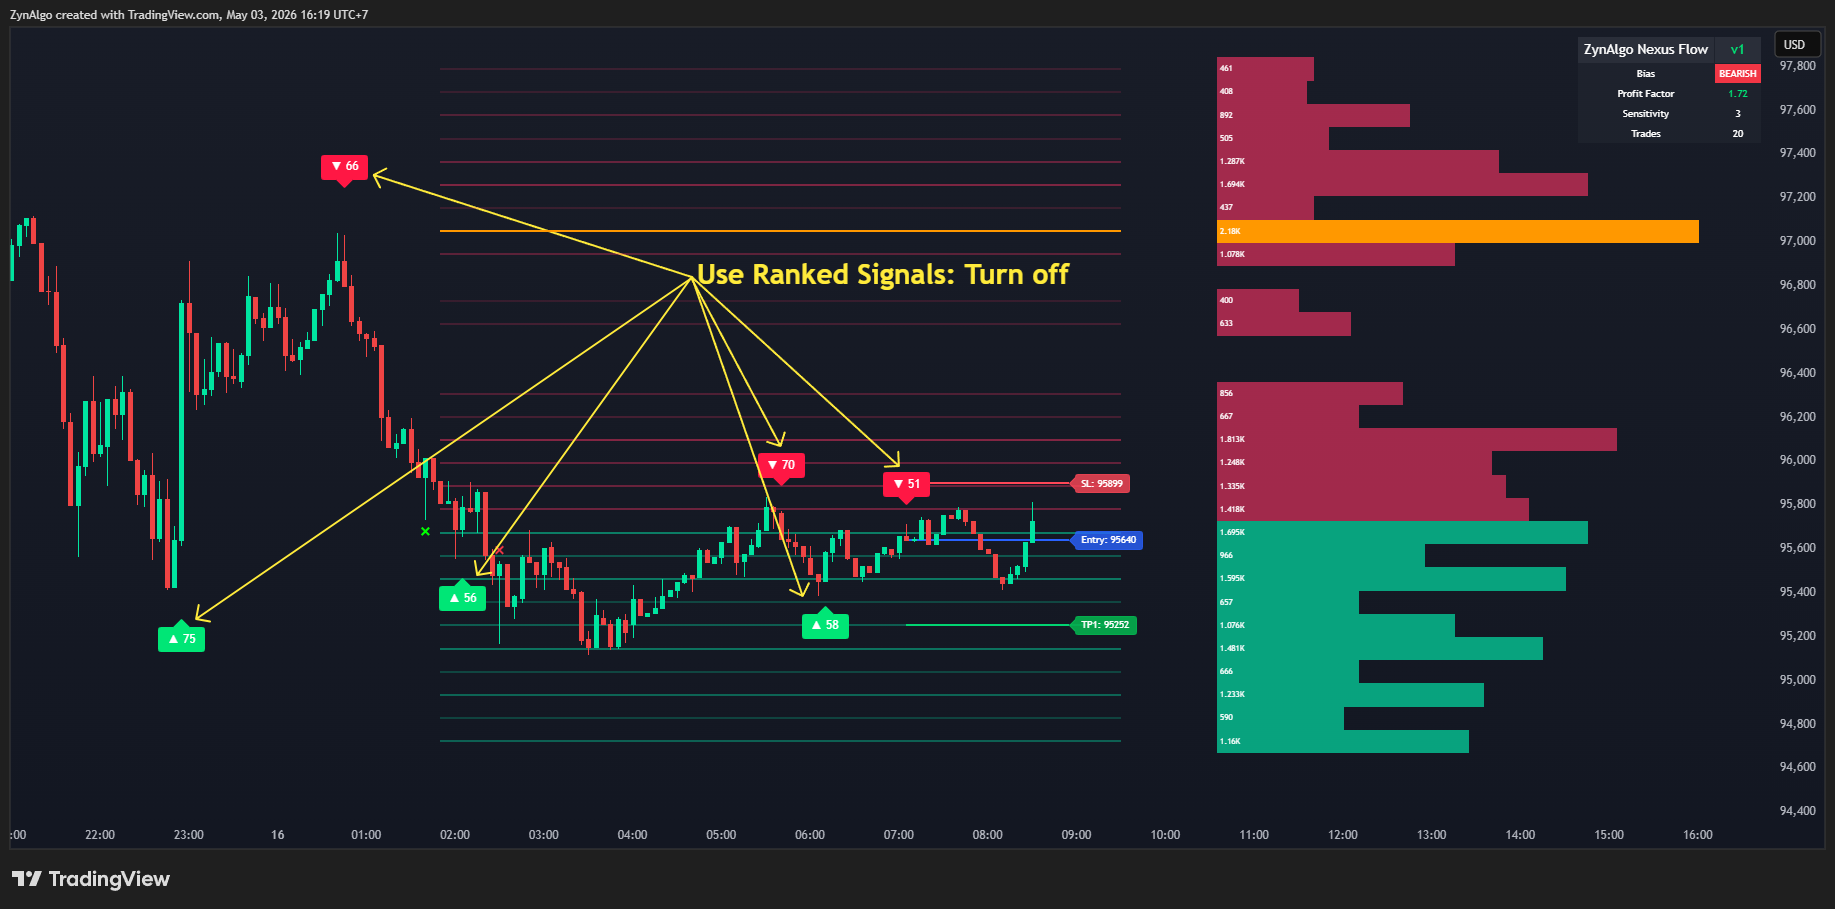
The technical components behind that definition, and what each one is responsible for:
- Pivot Sensitivity (default 3) - how many bars must sit on each side of a swing for it to count as a pivot. Because confirmation is required on both sides, pivots always carry a built-in delay.
- Volume MA Filter (default 20) - the moving average of volume that the signal bar must exceed. Lower values pass more bars, higher values demand steadier participation.
- ATR(14) - the volatility reference. It measures how deep the sweep went relative to normal range, and it sizes the stop distance.
- Liquidity Profile (Profile Range 300, Profile Density 50) - builds the horizontal volume boxes on the right of the chart from recent history. Range controls how far back it looks; Density controls how finely the price area is divided.
- POC (Point of Control) - the most prominent volume area in that profile, drawn as the orange line. A close within 0.5 ATR of the POC adds score, and the dashboard Bias reads BULLISH or BEARISH from where price closes relative to it. Bias is a reading, not an entry filter - it does not block signals.
- Ranked scoring - four components adding to a theoretical 100: pivot penetration (max 25), reclaim strength (max 30), POC proximity (20 or 0), volume strength (25 or 15).
Note that the Liquidity Profile and the POC are supporting context. They add score and drive the dashboard reading, but on their own they never create a BUY or SELL - the sweep and reclaim around a pivot has to happen first.
3. When trading opportunities appear
A BUY is generated when all of the following are true on the same closed bar:
- A confirmed pivot low is on record.
- The bar's low trades below that pivot low.
- The bar closes back above that pivot low.
- The close is above the open - a bullish candle.
- Volume is above the volume moving average set by Volume MA Filter.
A SELL is the mirror image:
- A confirmed pivot high is on record.
- The bar's high trades above that pivot high.
- The bar closes back below that pivot high.
- The close is below the open - a bearish candle.
- Volume is above the volume moving average.
With Use Ranked Signals enabled (the default), a qualifying setup must additionally reach a score of 60 or higher before it is allowed to print. With the option disabled, the sweep, reclaim and volume conditions alone are enough - more signals appear, and more of them are marginal.
The label itself is printed only after the bar closes: an arrow below the bar for BUY, above the bar for SELL, together with the rounded score for that signal. The score is what tells you how the setup rated - a signal at 62 and a signal at 94 look the same structurally but did not earn their points the same way.
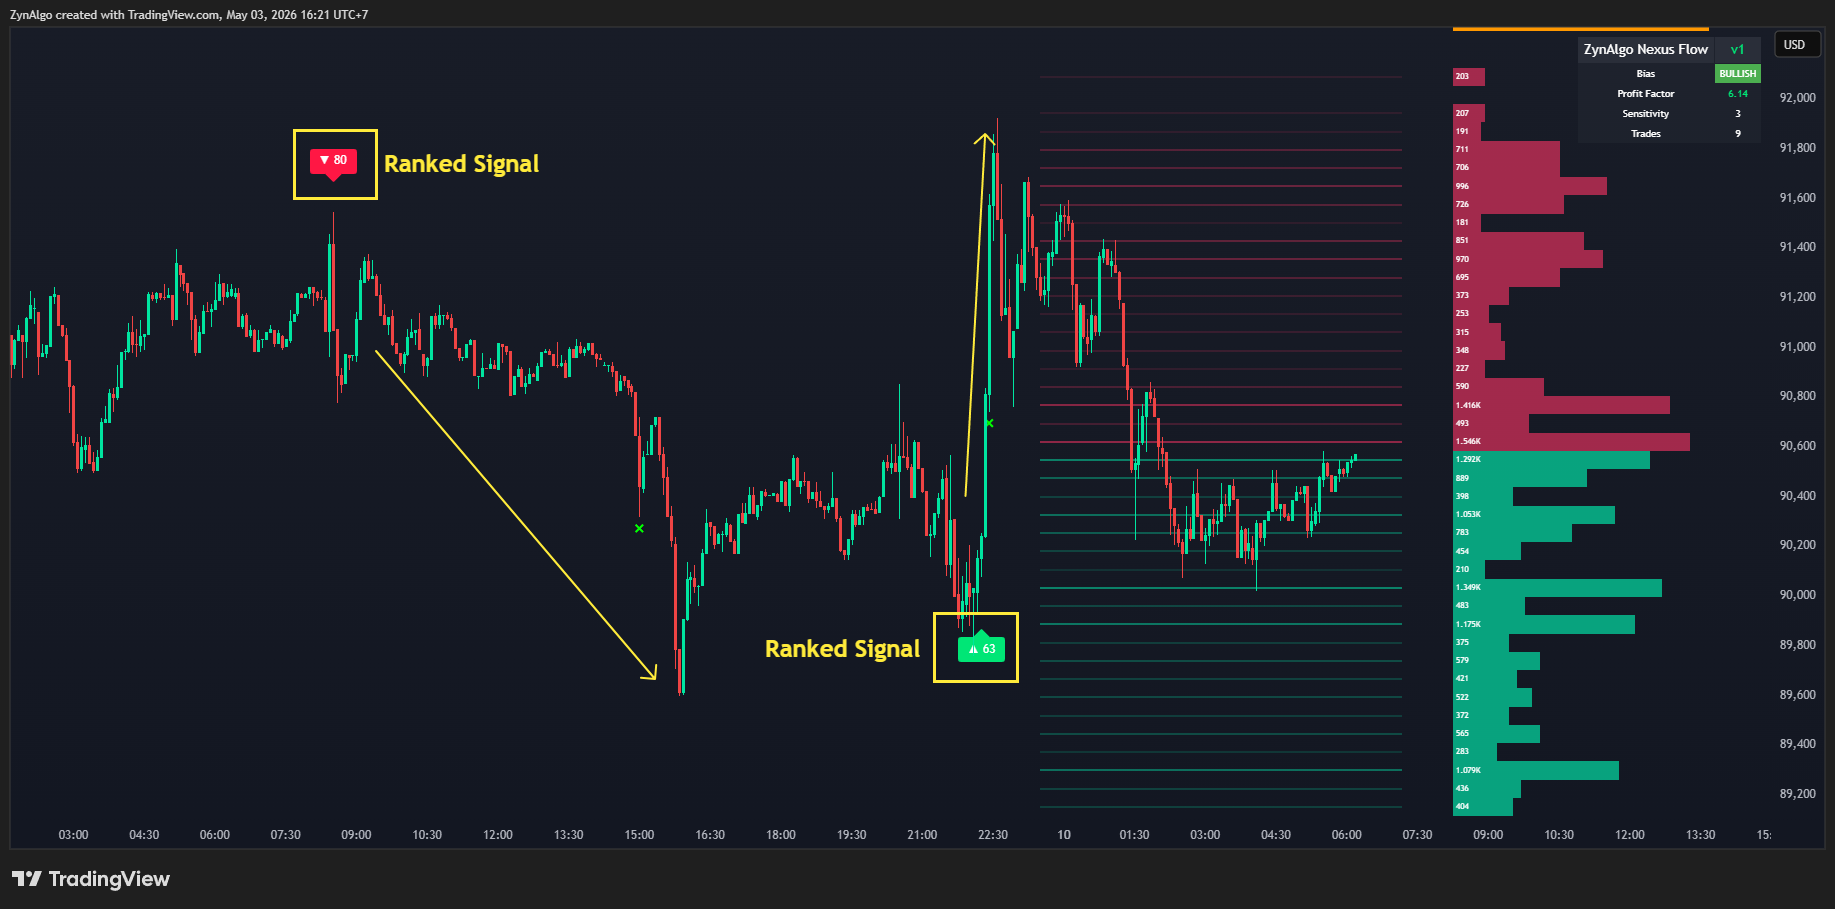
What the market is typically doing when a high-scoring signal prints:
- The sweep penetrated the pivot meaningfully relative to ATR, rather than nicking it by a tick.
- The bar closed near its own high (for BUY) or near its own low (for SELL) - a decisive reclaim rather than a hesitant one.
- The close landed within 0.5 ATR of the POC, in the area where volume is concentrated.
- Volume ran above 1.5x its moving average rather than only just clearing it.
Two optional filters change how often signals are allowed through. Stability Mode (off by default) blocks any new signal while a tracked position is still open - in both directions, so it also prevents an immediate reversal entry. Smart Signal Filter (off by default) forces signals to alternate, so a BUY cannot be followed by another BUY until a SELL has appeared. Independently of both, the pivot that produced a signal is cleared afterwards, so the same swing level does not fire repeatedly.
Once a signal prints, the levels are drawn for you. Entry is the close of the signal bar. Stop Loss sits one ATR(14) x Distance away (Distance default 2.8), and that distance becomes the risk unit. TP1, TP2 and TP3 are placed at R:R multiples of that risk - 1, 4.5 and 6.5 by default - with only TP1 enabled out of the box. When TP2 or TP3 is enabled, reaching TP1 activates breakeven, moving protection to the entry price. A tracked trade that is still open after 200 bars is closed out at the current price.
4. Best suited for
- Traders who work from swing structure and stop-hunt behaviour rather than from trend-following signals.
- Markets and timeframes where volume data is dependable - the entry filter and part of the score both compare volume to its own average, so instruments with unreliable volume weaken the whole logic.
- Traders who are comfortable waiting. Pivots need confirmation bars on both sides and labels only print on closed bars, so this is not a tool for acting mid-candle.
- Traders who want the risk framework drawn for them - an ATR-based stop and R:R targets - instead of placing levels by eye.
- Less suitable if you want constant activity: a sweep, a reclaim, a matching candle direction and above-average volume rarely line up, and with ranked signals on the count drops further.
The aim is not to catch every move. It is to have one clearly defined event that you can recognise, score and handle the same way each time it appears.
Trading involves risk. Nexus Flow is an analysis tool, not a guarantee of any outcome - always apply your own risk management.
- ZynAlgo Nexus Flow v1Aug 13, 2026
Why do my swing low entries get stopped out after the liquidity sweep
Price breaks below a swing low, triggers your stop, then reverses higher - leaving you out at the worst moment. Learn how to identify when a sweep has truly reclaimed the structure and when the failure matters.
Why liquidity sweep entries keep failing without reclaim confirmation
Traders entering on the break of a swing often get stopped when price snaps back. This guide explains how sweep-and-reclaim structure changes the timing.