
Micro-Profile
An order block is usually drawn as one flat rectangle, as if every price inside it mattered equally. Micro-Profile [ZynAlgo] pulls lower-timeframe data into each block and builds a volume distribution inside it, so you can see the one shelf where the volume actually accumulated.
Key benefits
- A profile inside every block - each zone is split into ten horizontal grids and the lower-timeframe volume is distributed across them, drawn as a histogram you read left to right.
- The POC marked, not guessed - the highest-volume grid is rendered at full opacity and its price is printed on the block's label.
- Lower-timeframe data chosen for you - the engine steps down to seconds or minutes depending on the chart timeframe, so the distribution has something to be built from.
- One marker per block - a diamond prints when price returns to the block, then that block stops signalling, which keeps repeated tests from cluttering the chart.
How it works
A run of same-direction candles ending in an opposite candle defines the block. Lower-timeframe highs, lows and volumes are then distributed across ten price grids inside it, the heaviest grid becomes the Point of Control, and the block is watched until price returns or trades through it. Full walkthrough in the Manual.
What's included / Platforms
- TradingView indicator, Pine Script v6, added to your TradingView username once access is granted. Released to ZynAlgo VIP members.
Best for
Order-block and supply/demand traders on volume-bearing markets - futures, indices, gold and crypto - who want to know which part of a zone holds the volume before deciding where to act inside it.
Get started
Browse the ZynAlgo marketplace
Disclaimer: an analysis tool, not financial advice or a signal service. Blocks, profiles and markers are context only, and no indicator removes market risk - trade with your own plan and position sizing.
Micro-Profile
Why one rectangle is not enough
An order block drawn as a single box says one thing: institutional activity happened somewhere in here. It does not say where. Price can spend an hour inside a zone and only a narrow shelf of it ever held real volume.
Micro-Profile takes each block it finds and looks inside it, using data from a lower timeframe than the one you are watching. What comes back is a distribution: ten horizontal grids across the height of the block, each one as long as the volume it holds.
What lands on your chart for every block:
- The macro box itself, coloured by direction - one palette for bullish blocks, another for bearish.
- A horizontal volume histogram inside it, with the heaviest grid drawn solid as the Point of Control.
- A label at the right edge reading the direction, the total volume held, and the POC price.
- A diamond on the bar where price came back and tested it.
Nothing about the distribution is estimated from the chart timeframe. If the lower-timeframe feed is unavailable, the block still draws, but the profile falls back to a flat distribution - and a flat profile is your signal that the detail is missing.
How a block is found, and what fills it
Two separate mechanisms run here, and they answer different questions: where is the block, and what is inside it.
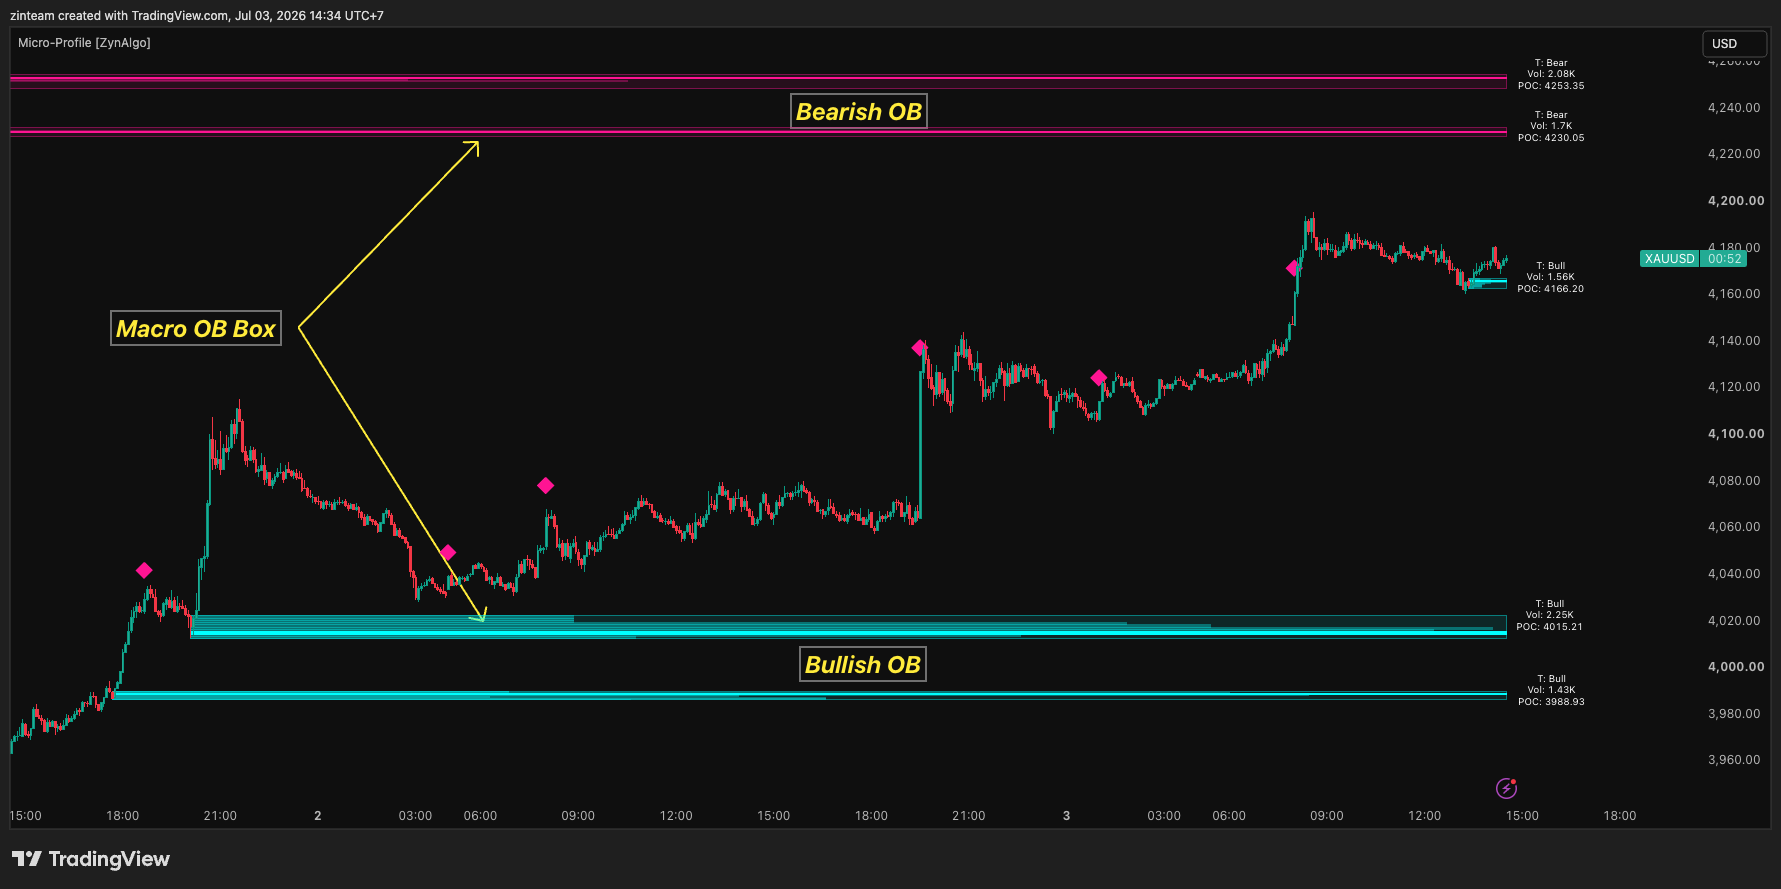
- A block is defined by a candle sequence - by default a run of seven candles moving one way that ends with a candle closing the other way, the classic order block shape.
- The block is anchored to the candle that started the run, taking its high and low as the boundaries.
- Only confirmed bars create blocks, so a block that appears will not disappear again on the next tick.
- Direction sets the palette: bullish blocks and bearish blocks are never the same colour.
How the inside is measured
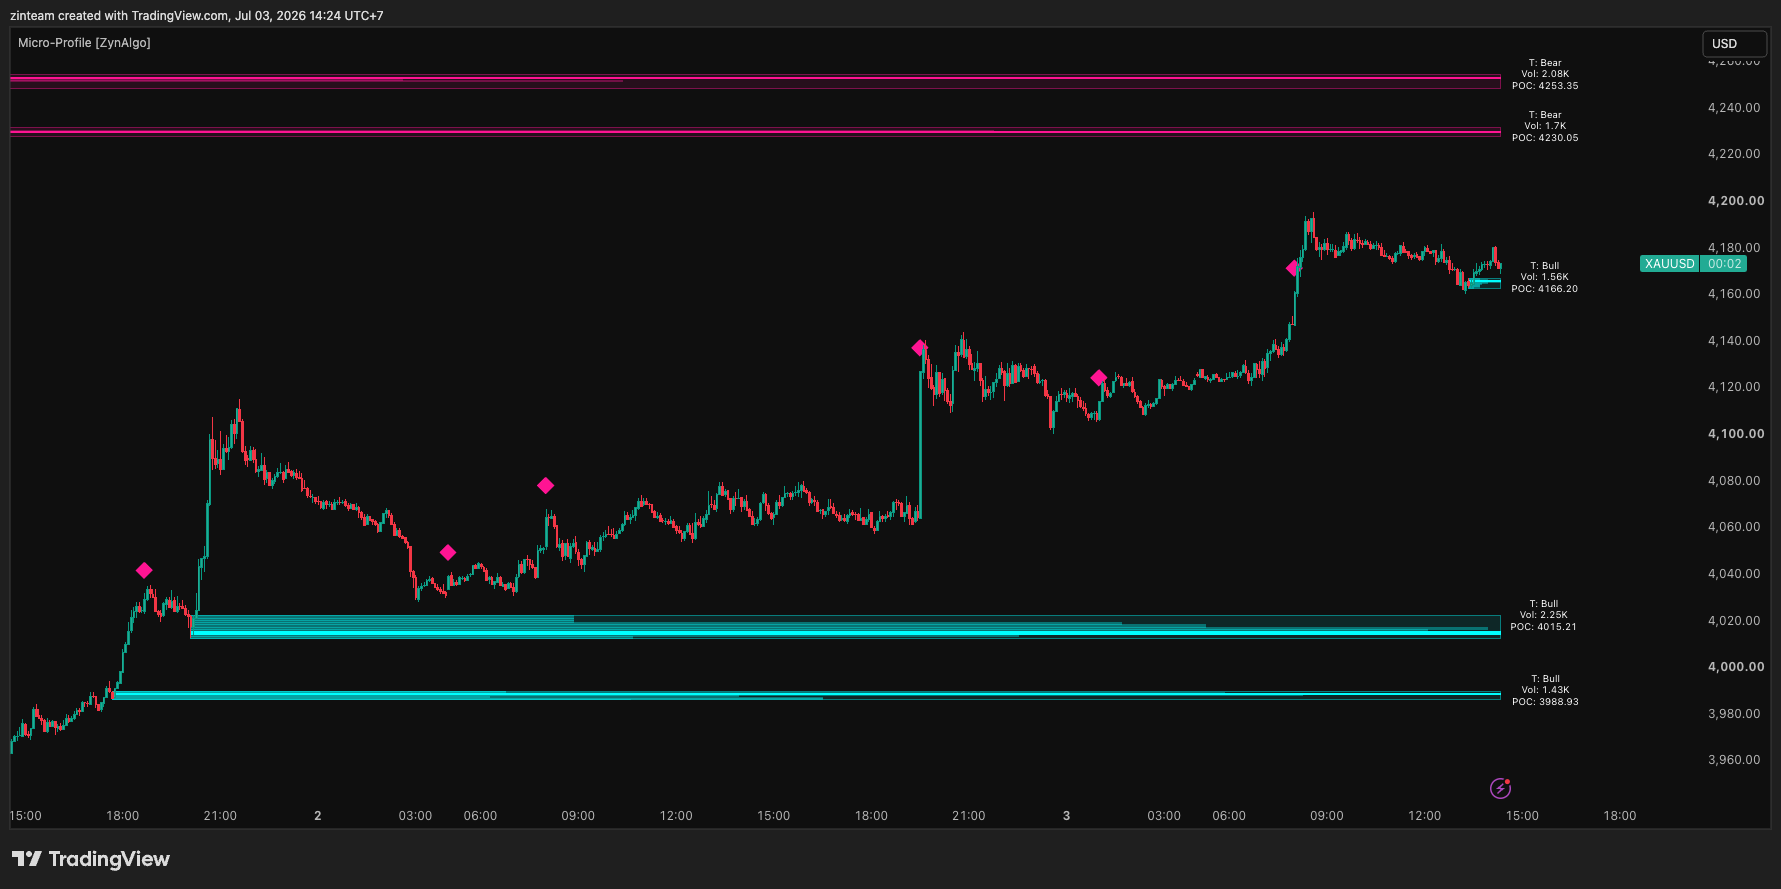
- The height of the block is divided into ten grids by default; more grids give finer resolution and a busier picture.
- Lower-timeframe candles are pulled in and each one's volume is split across the grids it overlaps, in proportion to how much of that candle sat in each grid.
- The timeframe is chosen for you: a seconds chart or the one-minute pulls one-second data, three to fifteen minutes pull one-minute, thirty and sixty pull five-minute, anything higher pulls fifteen-minute.
- The heaviest grid becomes the Point of Control - drawn solid while the rest stay translucent - and its price goes on the label.
- Grid length is scaled so the histogram fills the width the block has been alive, which is why the profile stretches as a block ages.
Reading a signal
The profile is context. The marker is the moment price came back to collect it.
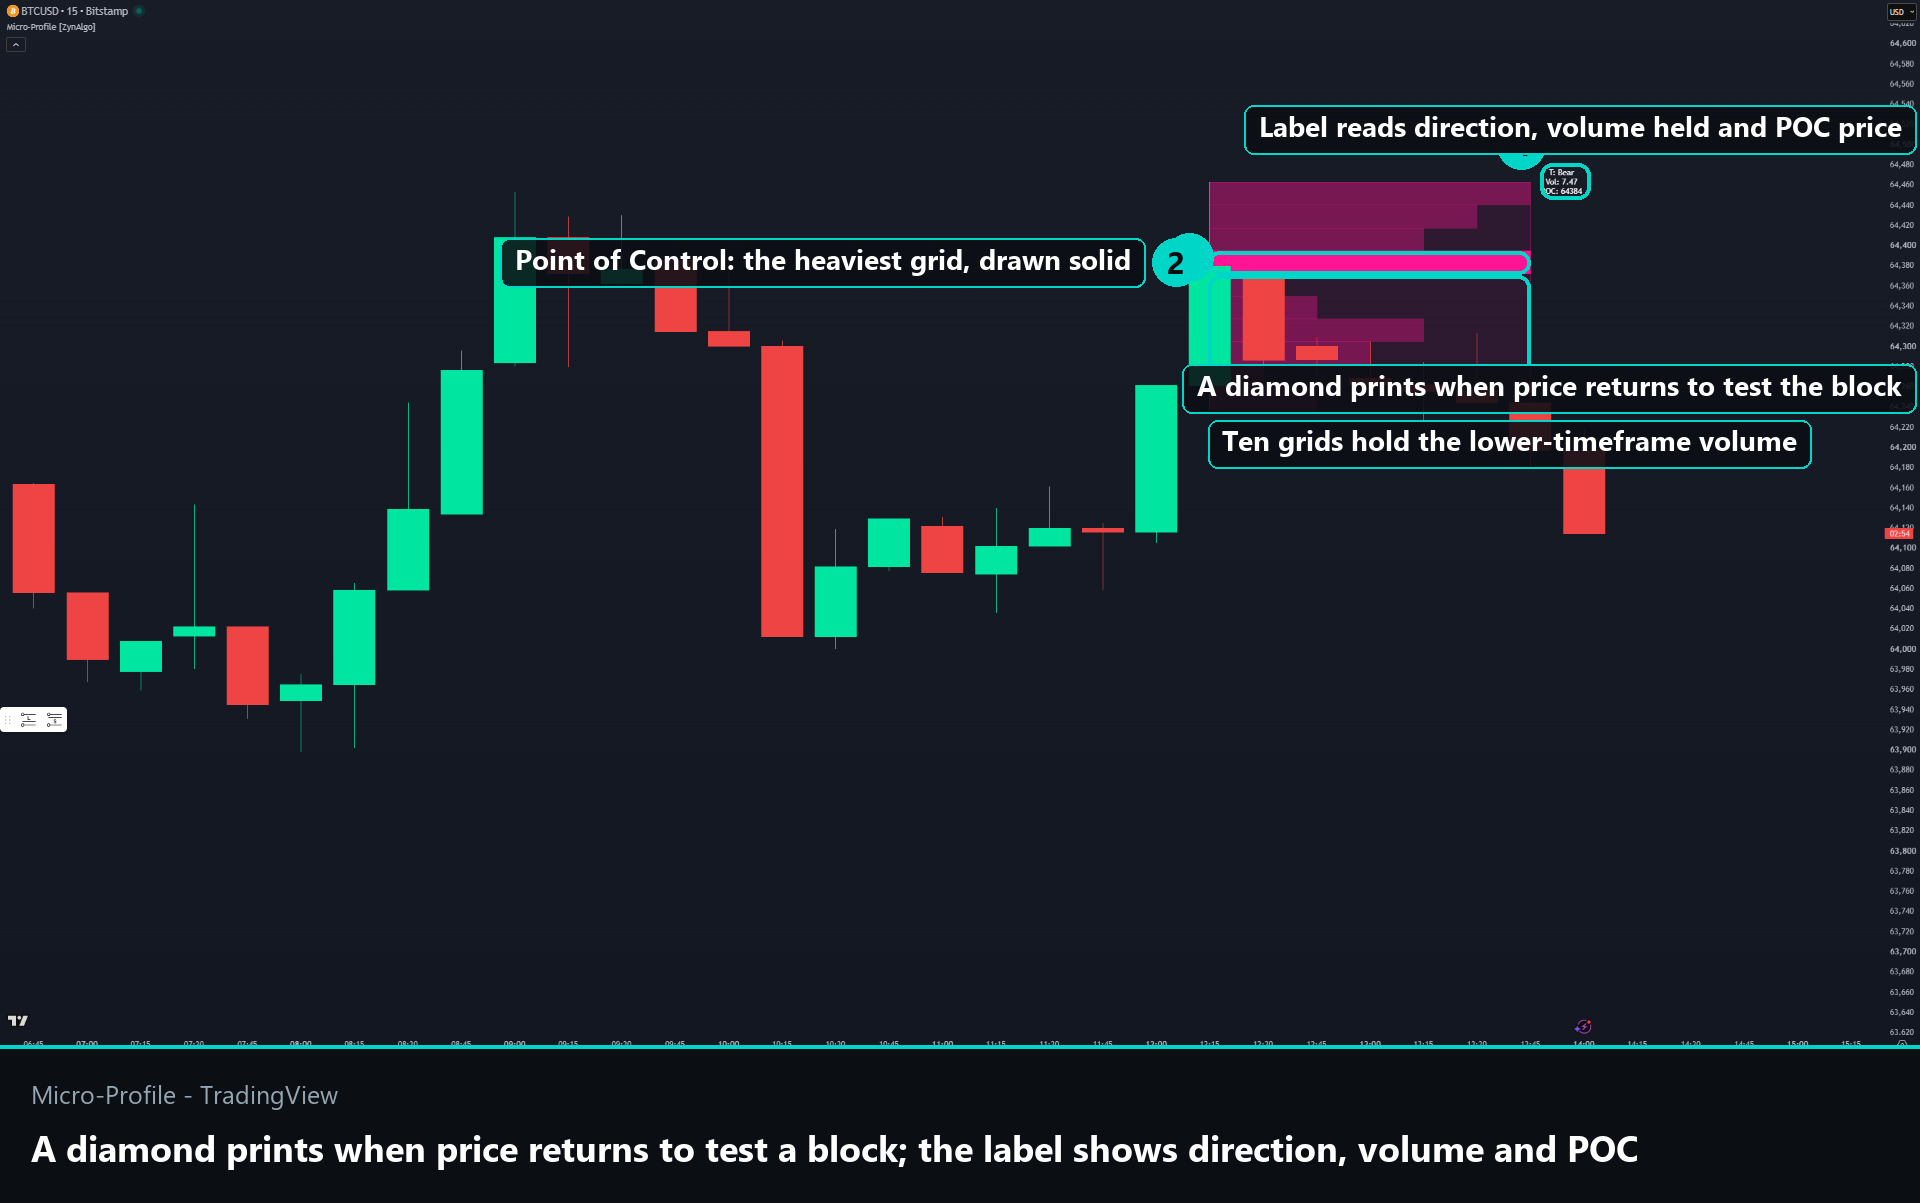
A diamond prints when price returns and touches the block - the low reaching into a bullish block, or the high reaching into a bearish one.
- Each block signals once by default. After that it is marked as used and stays on the chart as context without producing further markers.
- A five-bar cooldown applies across all blocks, so several zones stacked together cannot fire in the same handful of candles.
- A block is removed entirely when price closes through its far side, which is the difference between a zone being tested and a zone being invalidated.
- Both behaviours are adjustable: allow more signals per block if you trade repeated tests, or lengthen the cooldown on fast charts.
The most useful way to read the marker is together with the POC line on the label. A test that reaches the POC shelf is a different proposition from one that clips the edge of the block, and the tool gives you both numbers to make that call yourself.
Best suited for
It fits you if:
- You already trade order blocks or supply and demand, and want to know which part of the zone matters.
- You work on markets with real volume - futures, indices, gold, crypto - where a lower-timeframe distribution is meaningful.
- You would rather see one marker per zone than a marker on every retest.
Settings are deliberately few: the candle sequence that defines a block, the number of grids, the lower-timeframe choice, and two signal constraints. The one to look at first is the grid count, which trades resolution against readability.
It fits you less on thin instruments or long chart timeframes, where the lower-timeframe history TradingView can supply runs out and the profile has less to work with.
Browse the ZynAlgo marketplace
Disclaimer: an analysis tool, not financial advice or a signal service. Blocks, profiles and markers are context only, and no indicator removes market risk - trade with your own plan and position sizing.
- Micro-Profile [ZynAlgo] v1Aug 13, 2026





