Dynamic Trail Regime
One adaptive trailing stop that tells you the market regime at a glance - and, only when the market is genuinely ranging, hunts high-quality pullback entries built from a rejection candle plus order-flow agreement. Dynamic Trail Regime [ZynAlgo] is a clean context map and a full trade-planning overlay in one indicator, switched by a single Trade Mode toggle.
Key benefits
- Regime at a glance: a smoothed ATR Supertrend that never zig-zags, colour-coded teal (Uptrend), red (Downtrend) and yellow (Sideway), so you always know the backdrop you are trading.
- Signals only where they belong: pullback entries fire only during a genuine range, and only when a pinbar rejection and an intrabar delta proxy both agree with direction - spaced by a cooldown and capped per trend.
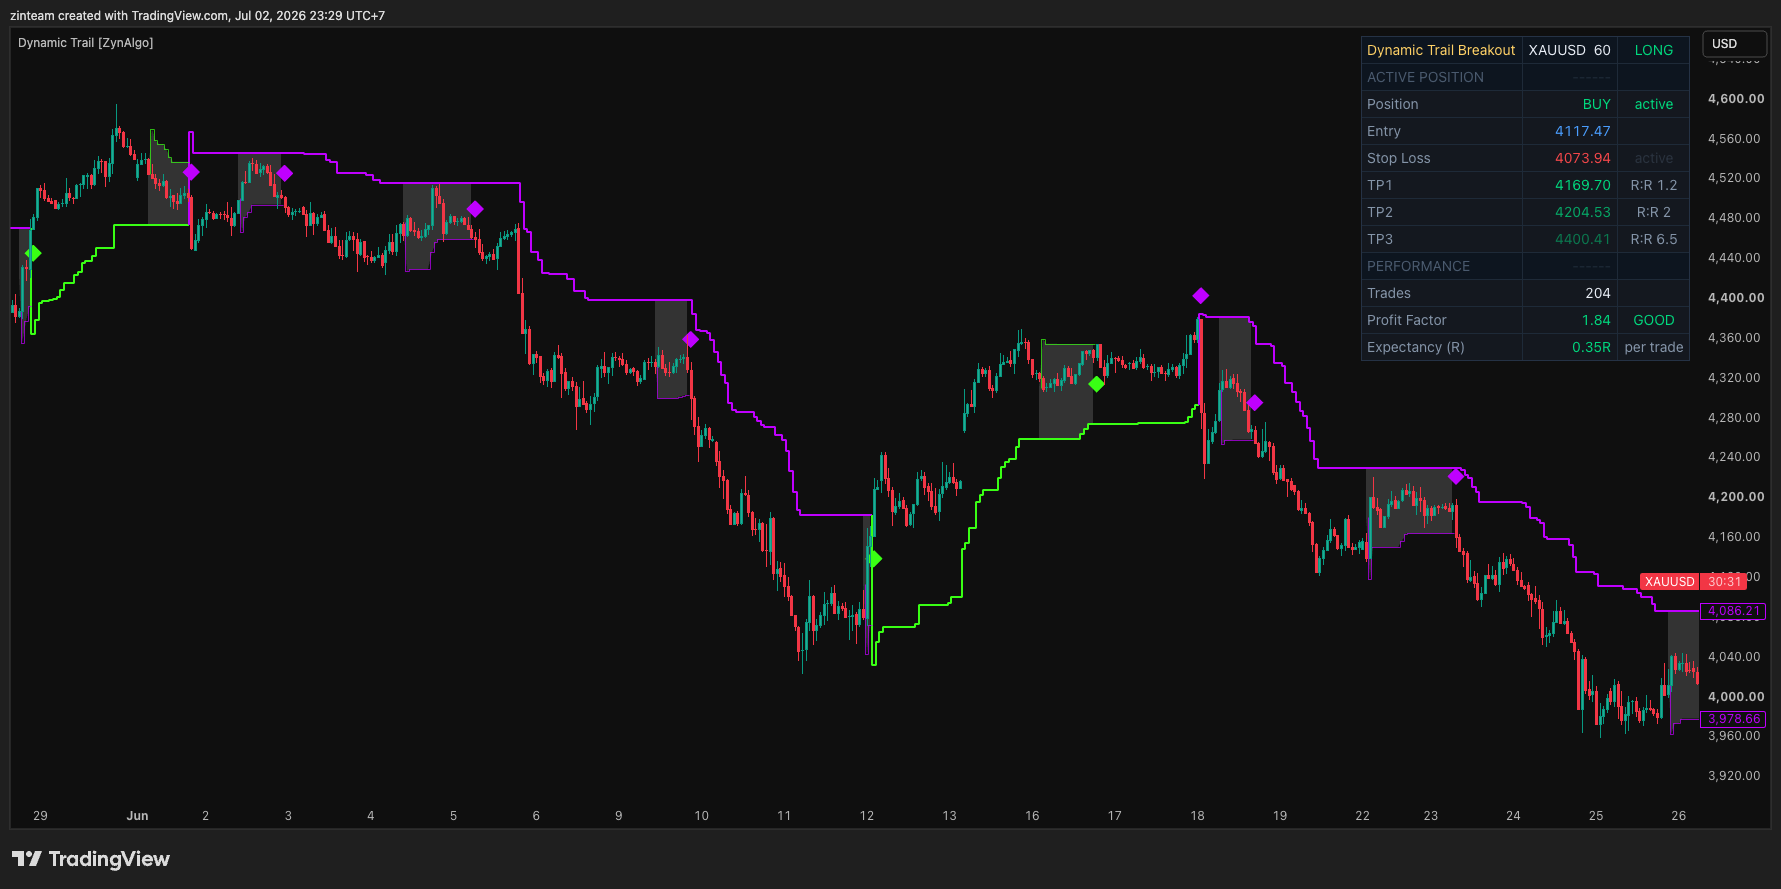
- Context map or full plan: Trade Mode off keeps the chart clean (trail + markers); Trade Mode on adds risk/reward boxes, ATR stop, 1R/2R/3R targets and a performance dashboard.
How it works
Direction comes from the Supertrend flip; a net-displacement test with hysteresis flags Sideway without mistaking a steady trend for a range. Inside a range, a pinbar with a dominant rejection wick plus a tick-rule delta proxy triggers a BUY or SELL aligned with the trail. Trade Mode reveals a full plan with entry, stop, targets and an internal-simulation dashboard. Full walkthrough in the Manual.
What's included / Platforms
- TradingView indicator, Pine Script v6, added to your TradingView username once access is granted. Released to ZynAlgo VIP members.
Best for
Trend-followers and pullback traders who want one unambiguous regime read plus rejection-based entries that only fire inside a real range.
Get started
Browse the ZynAlgo marketplace
Disclaimer: for research and education only, not financial advice. The Win Rate and W/L figures come from an internal, non-executed simulation and the delta reading is a simulated proxy, not genuine order-flow. Signals are not guarantees and no indicator removes market risk - trade with your own plan and position sizing.
Dynamic Trail Regime
Reading the market through the Dynamic Trail regime.
Dynamic Trail Regime does two jobs on one chart. First it draws a single adaptive trailing stop that classifies the market into three regimes at a glance - Uptrend, Downtrend and Sideway - so you always know the backdrop you are trading in. Then, only while the market is genuinely going sideways, it looks for high-quality pullback entries built from a rejection candle plus supporting order-flow pressure. Everything is controlled by one switch, Trade Mode, so the tool can be a clean context map or a full trade-planning overlay depending on how you work.
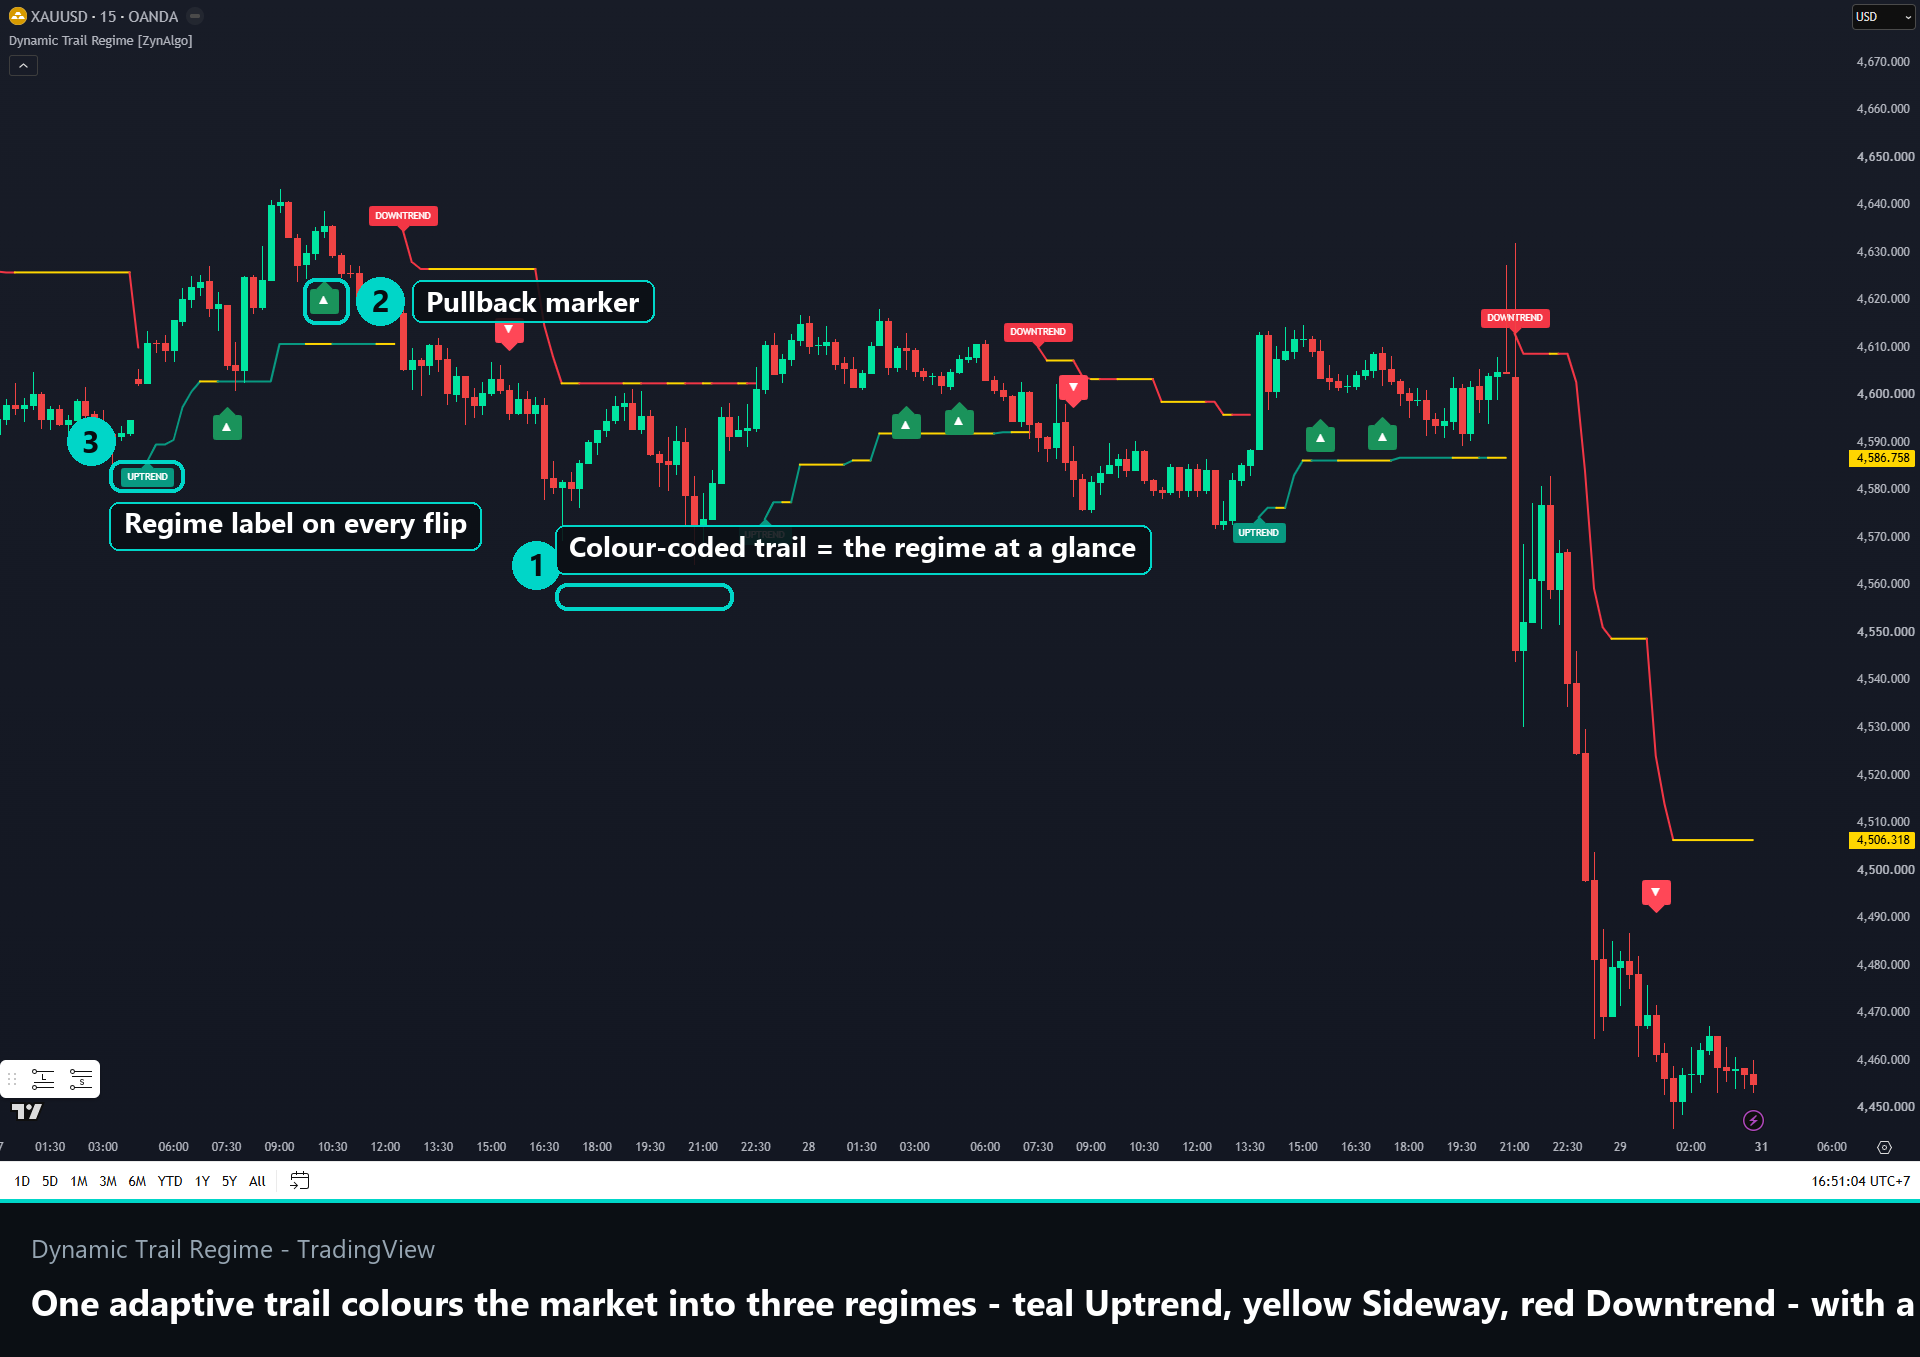
The trailing line is an ATR-based Supertrend that is smoothed so it never zig-zags: in an uptrend it can only rise or hold, in a downtrend it can only fall or hold, and during a sideway stretch it simply holds its level. Its colour is the fastest read on the chart - teal for Uptrend, red for Downtrend, and yellow when the market is ranging. When Trade Mode is off you also get a compact UPTREND / DOWNTREND label the moment the regime flips.
The three regimes and the pullback engine
The value of this tool comes from keeping the regime and the entry logic separate, then only letting them fire together at the right time.
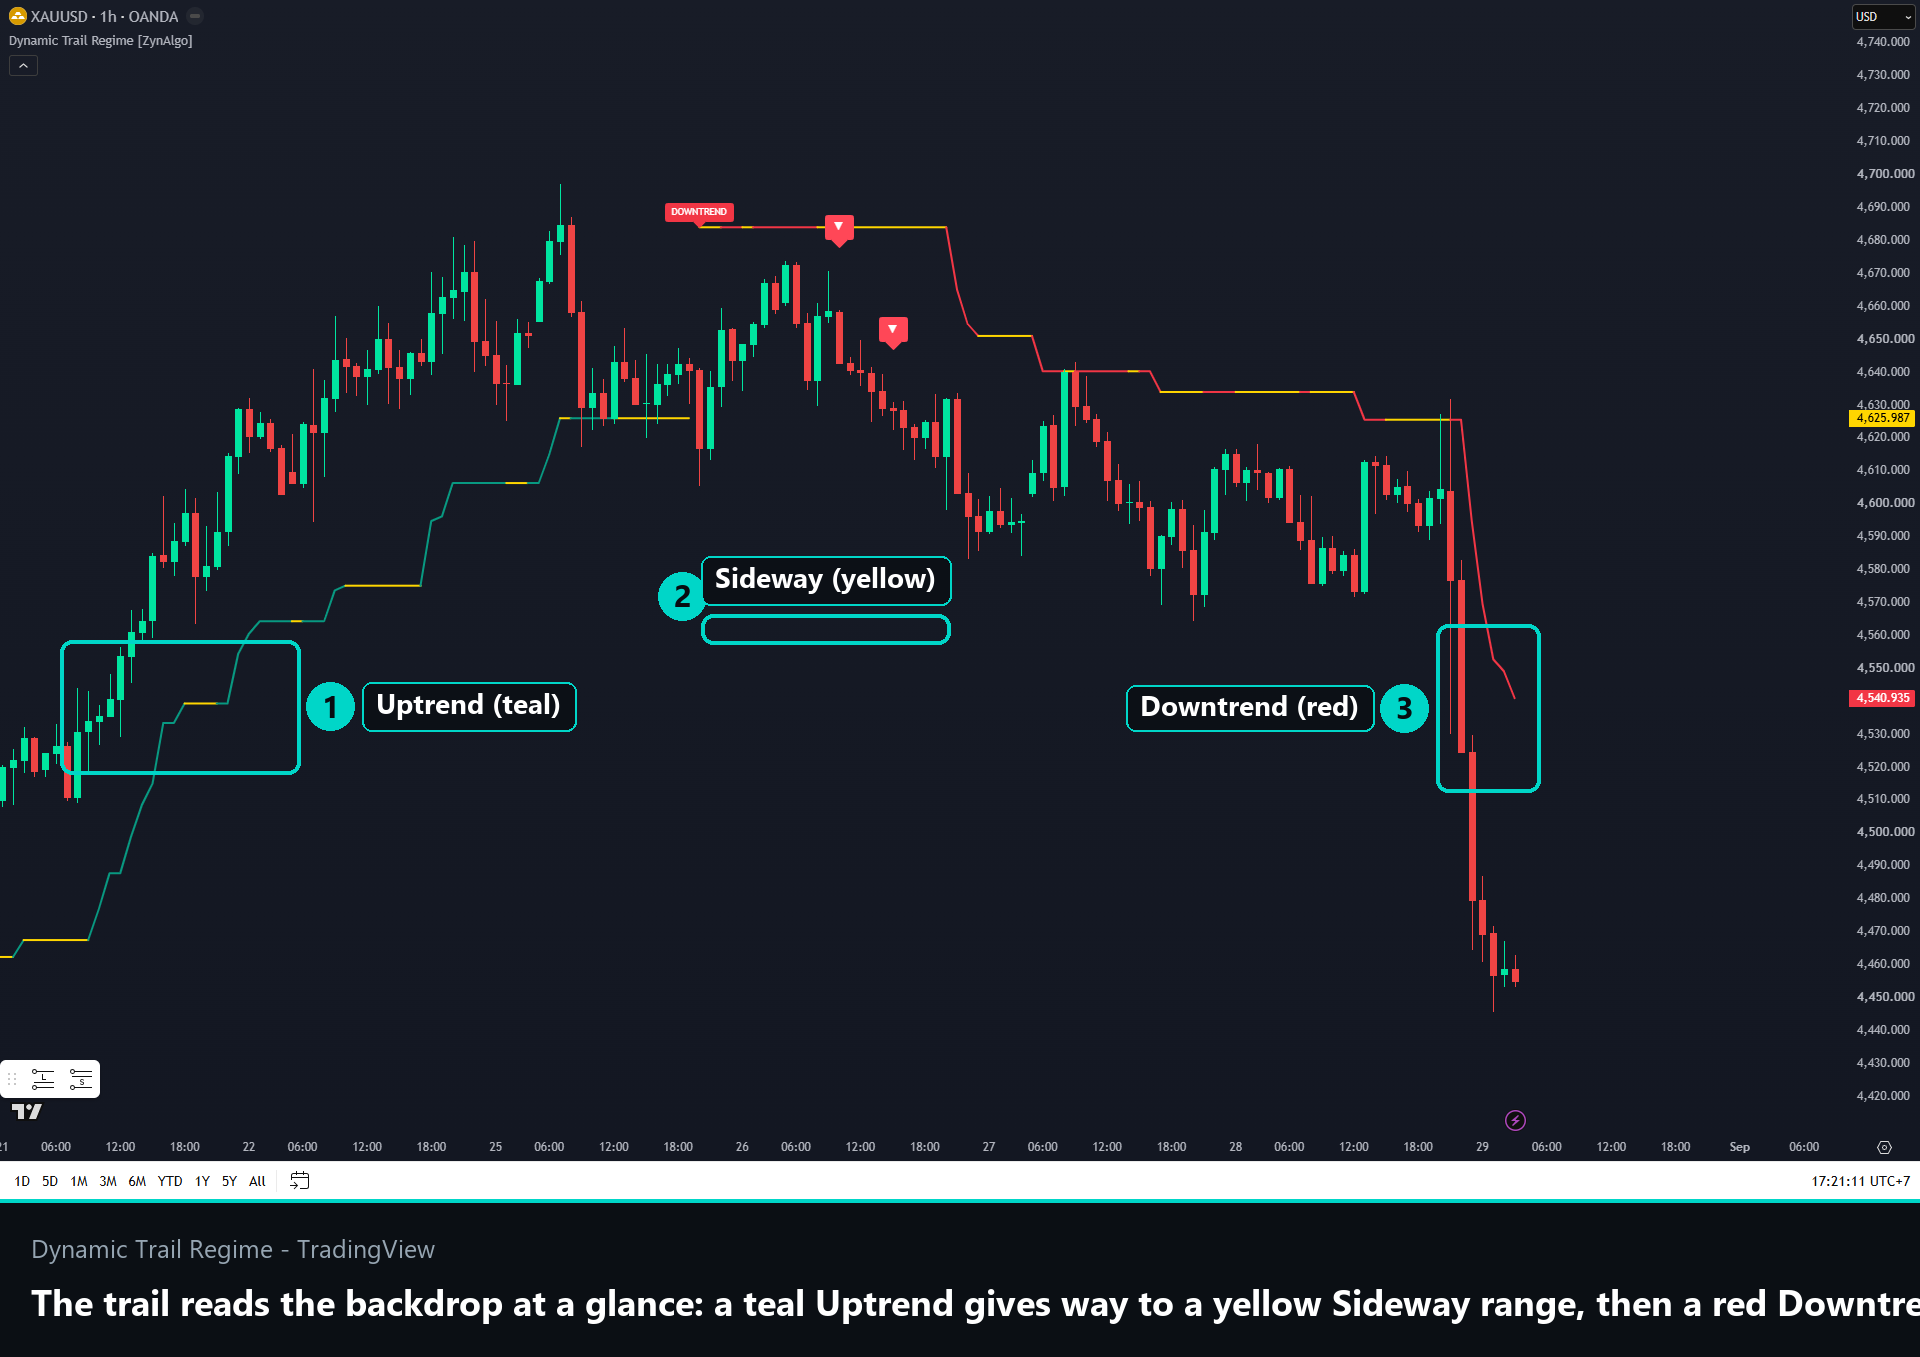
- Regime (the trail): direction comes straight from the Supertrend flip - price above the trail is an Uptrend, price below it is a Downtrend.
- Sideway detection (net displacement + hysteresis): the market is called Sideway when the net distance price has travelled over the last few bars stays small relative to a slow ATR baseline. Using net displacement - not raw single-candle range - means a steady one-directional trend of similar-sized candles is not mistaken for a range. Once Sideway is active, leaving it requires a clearly larger move (a hysteresis multiplier), so a single noisy bar cannot break an otherwise flat stretch.
- The pullback signal (necessary + sufficient + confirmation): a signal needs all three - the market must be Sideway (necessary), a pinbar rejection candle must form with its rejection wick clearly longer than the opposite wick (sufficient), and an intrabar delta proxy must agree with the direction (confirmation). Delta is estimated with a tick-rule on a lower timeframe, since TradingView has no real order-flow feed.
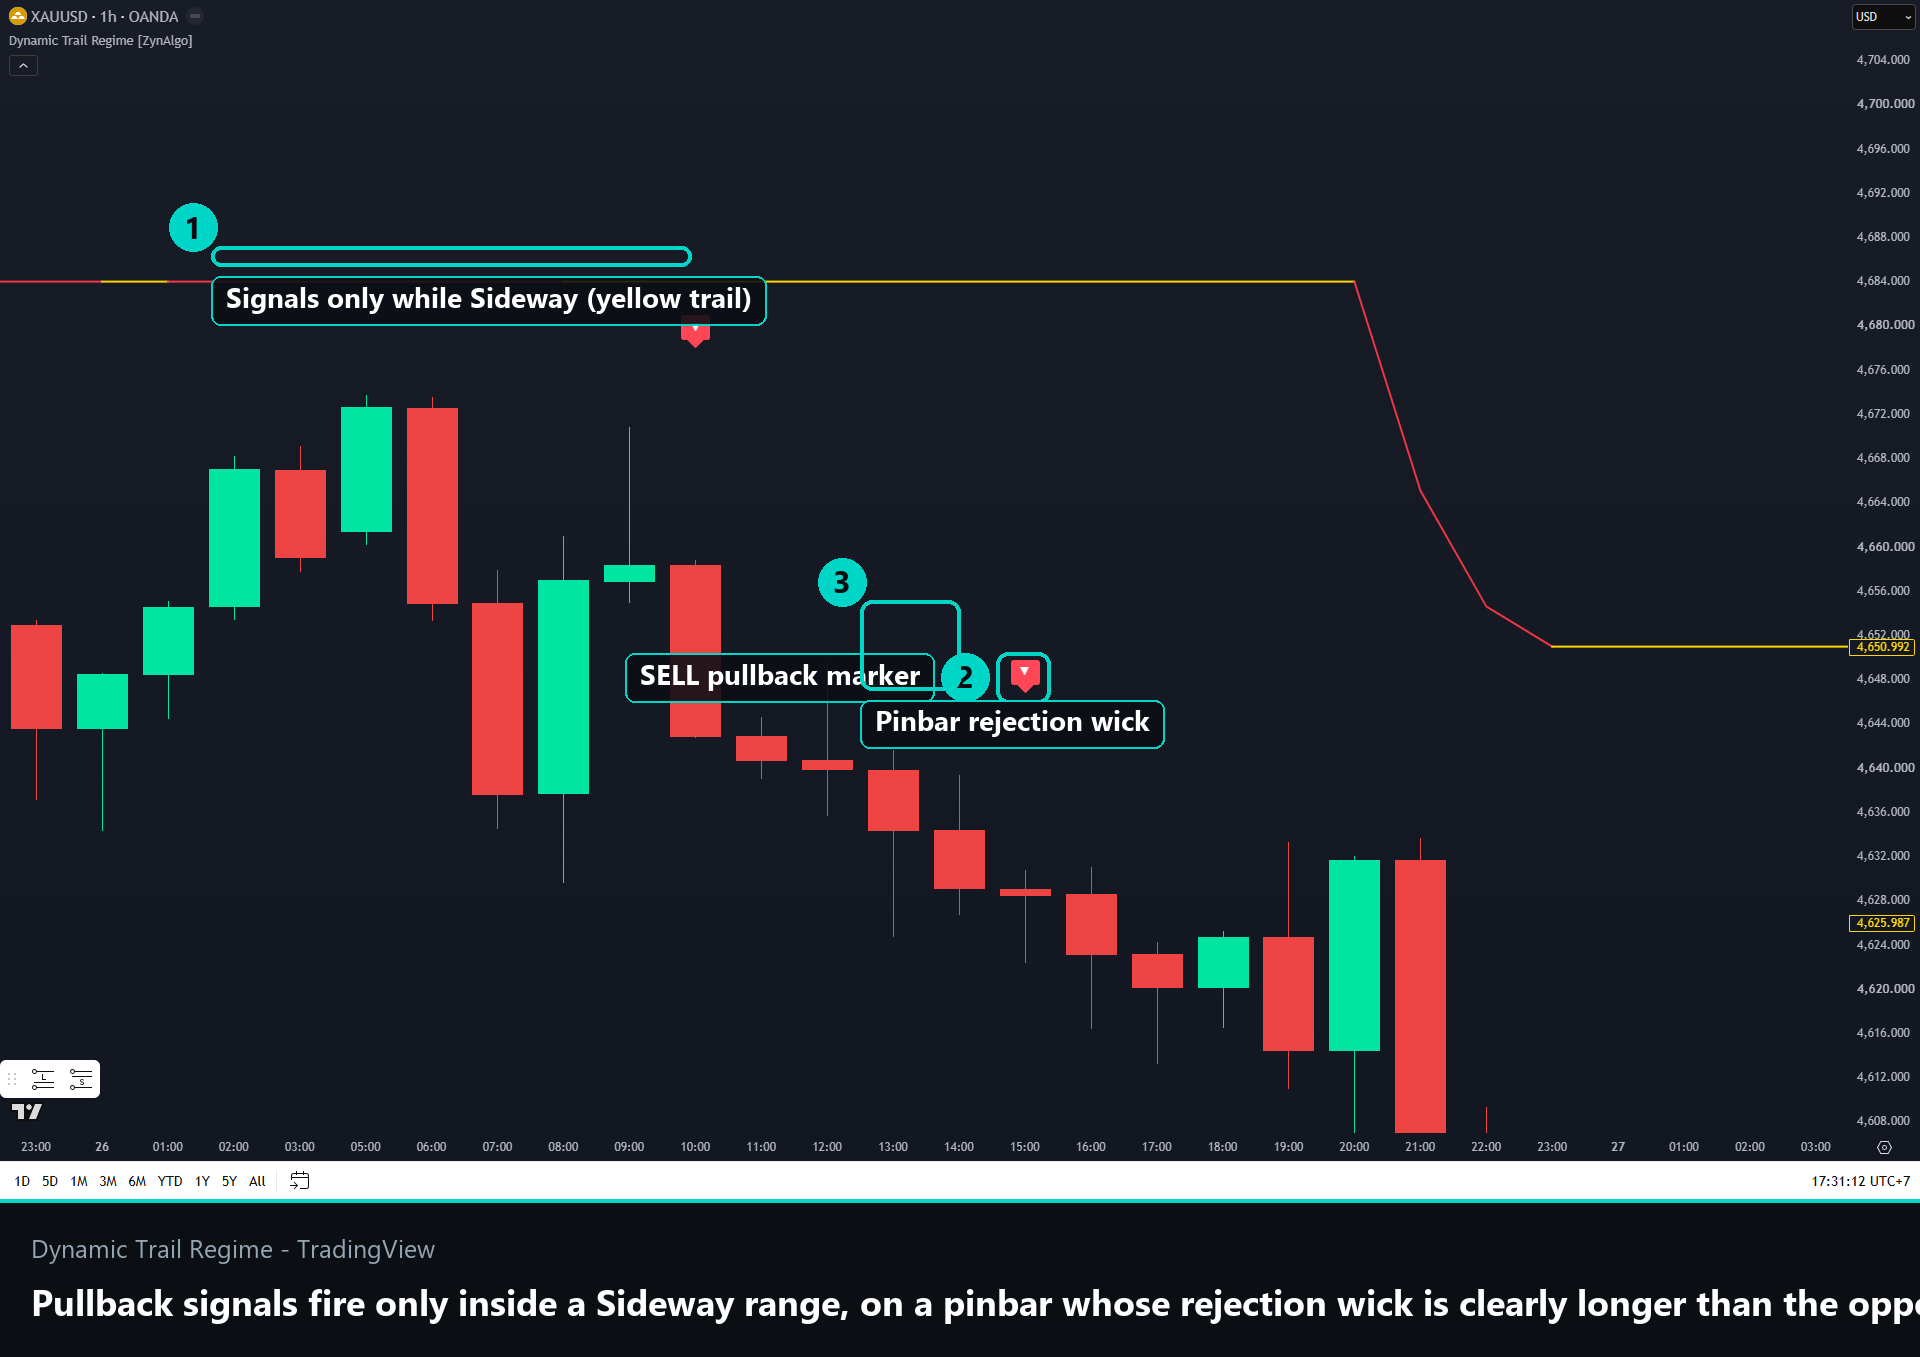
Signals are further spaced out by a cooldown and capped per trend (the counter resets every time the regime flips), so you get a small number of considered entries rather than a stream of markers. A BUY prints as an up triangle below the bar and a SELL as a down triangle above it.
How to trade the pullback signals
The regime map and the signals are meant to be used together, and the Trade Mode switch decides how much the tool shows you.
- Context first: lean with the regime. The tool only looks for BUY pullbacks while direction is up and SELL pullbacks while direction is down, so a signal already agrees with the prevailing trail direction.
- Trade Mode OFF (default): the chart stays clean - just the colour-changing trail plus the pullback markers. Use this when you want context and entry cues but will manage risk yourself. The execution filters are bypassed in this mode.
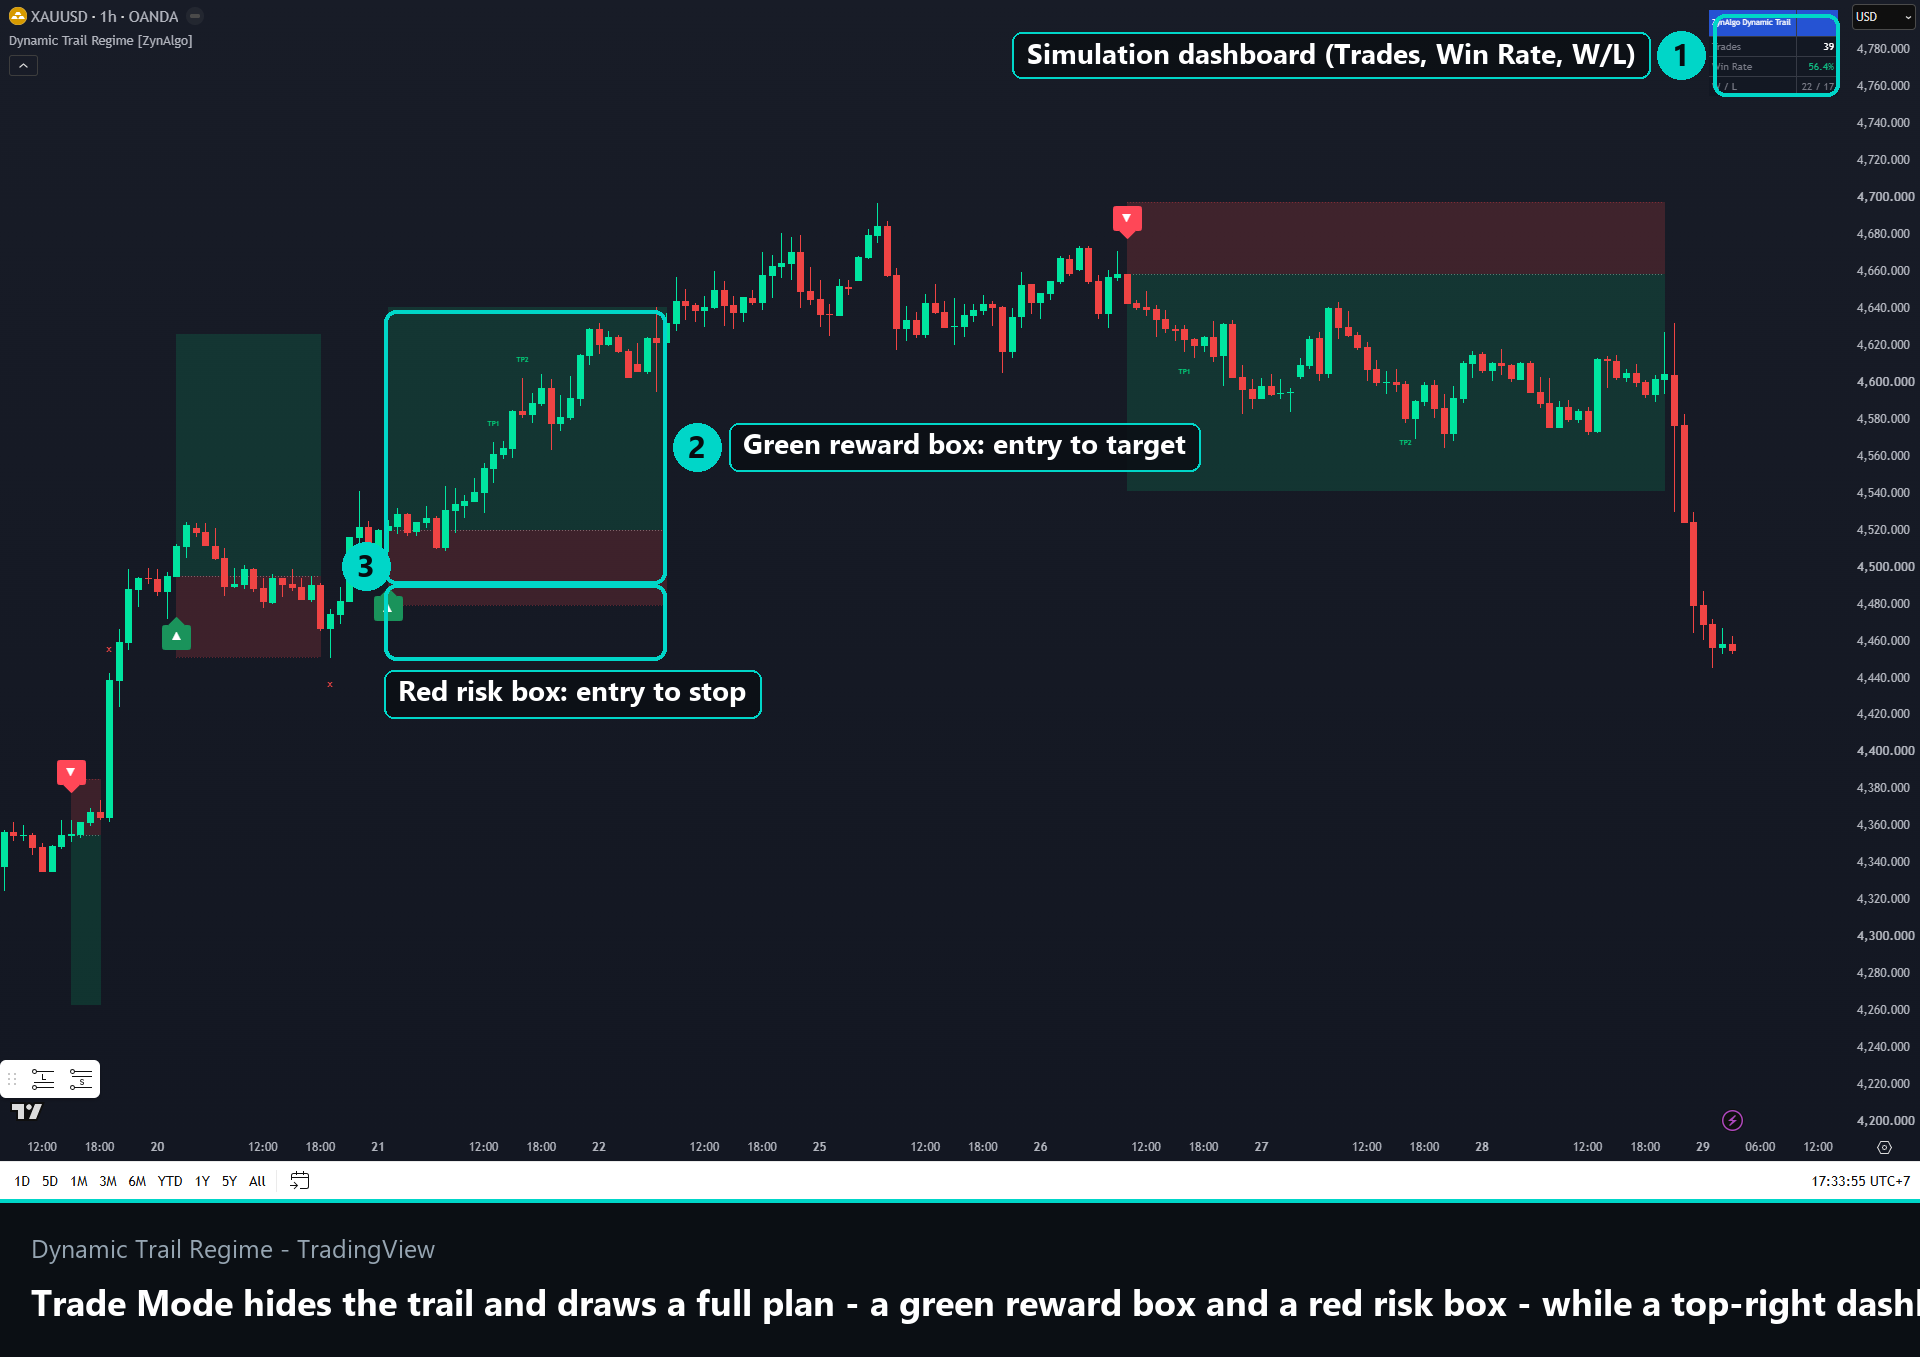
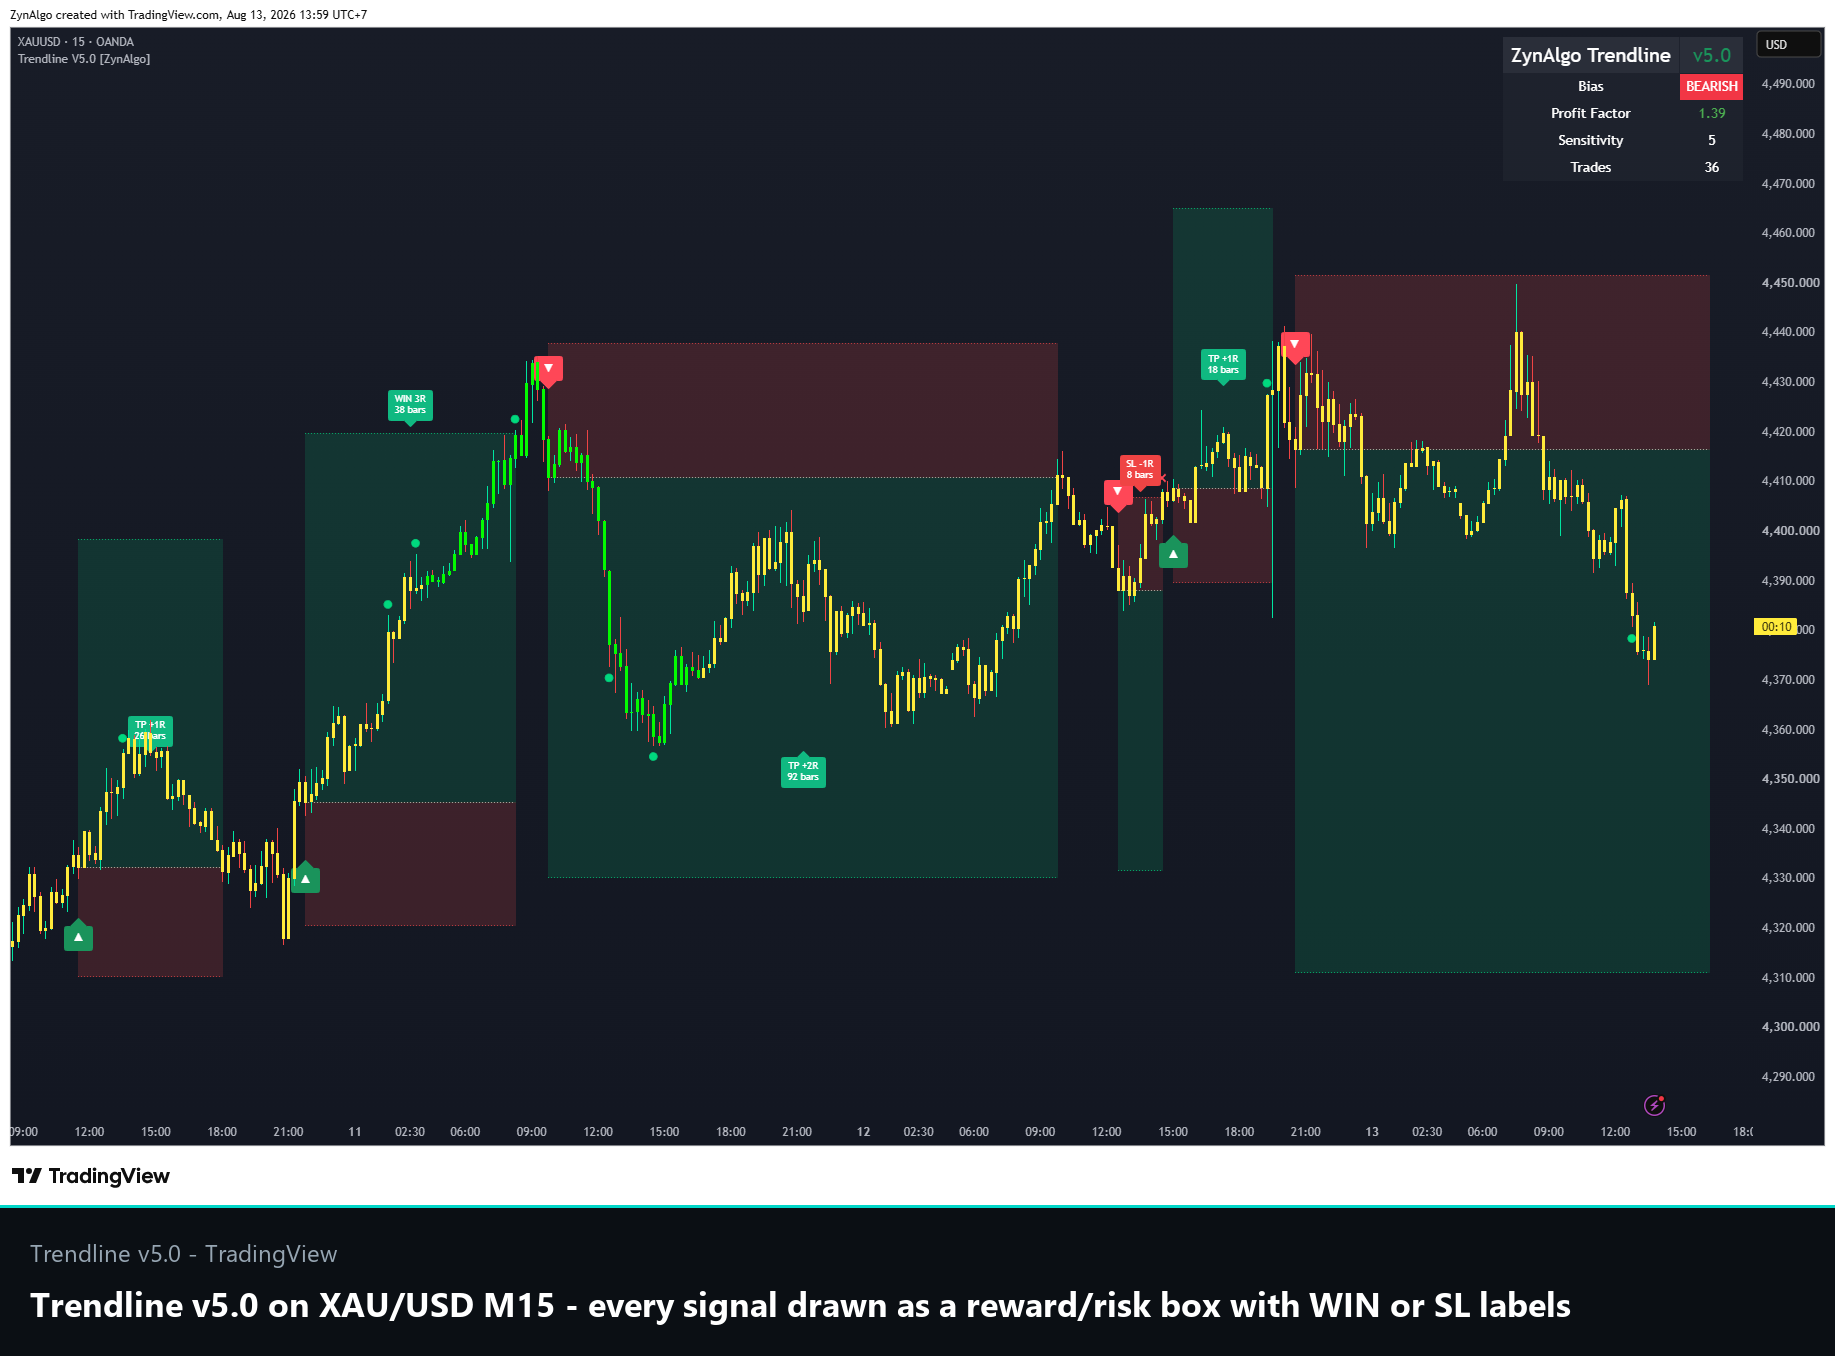
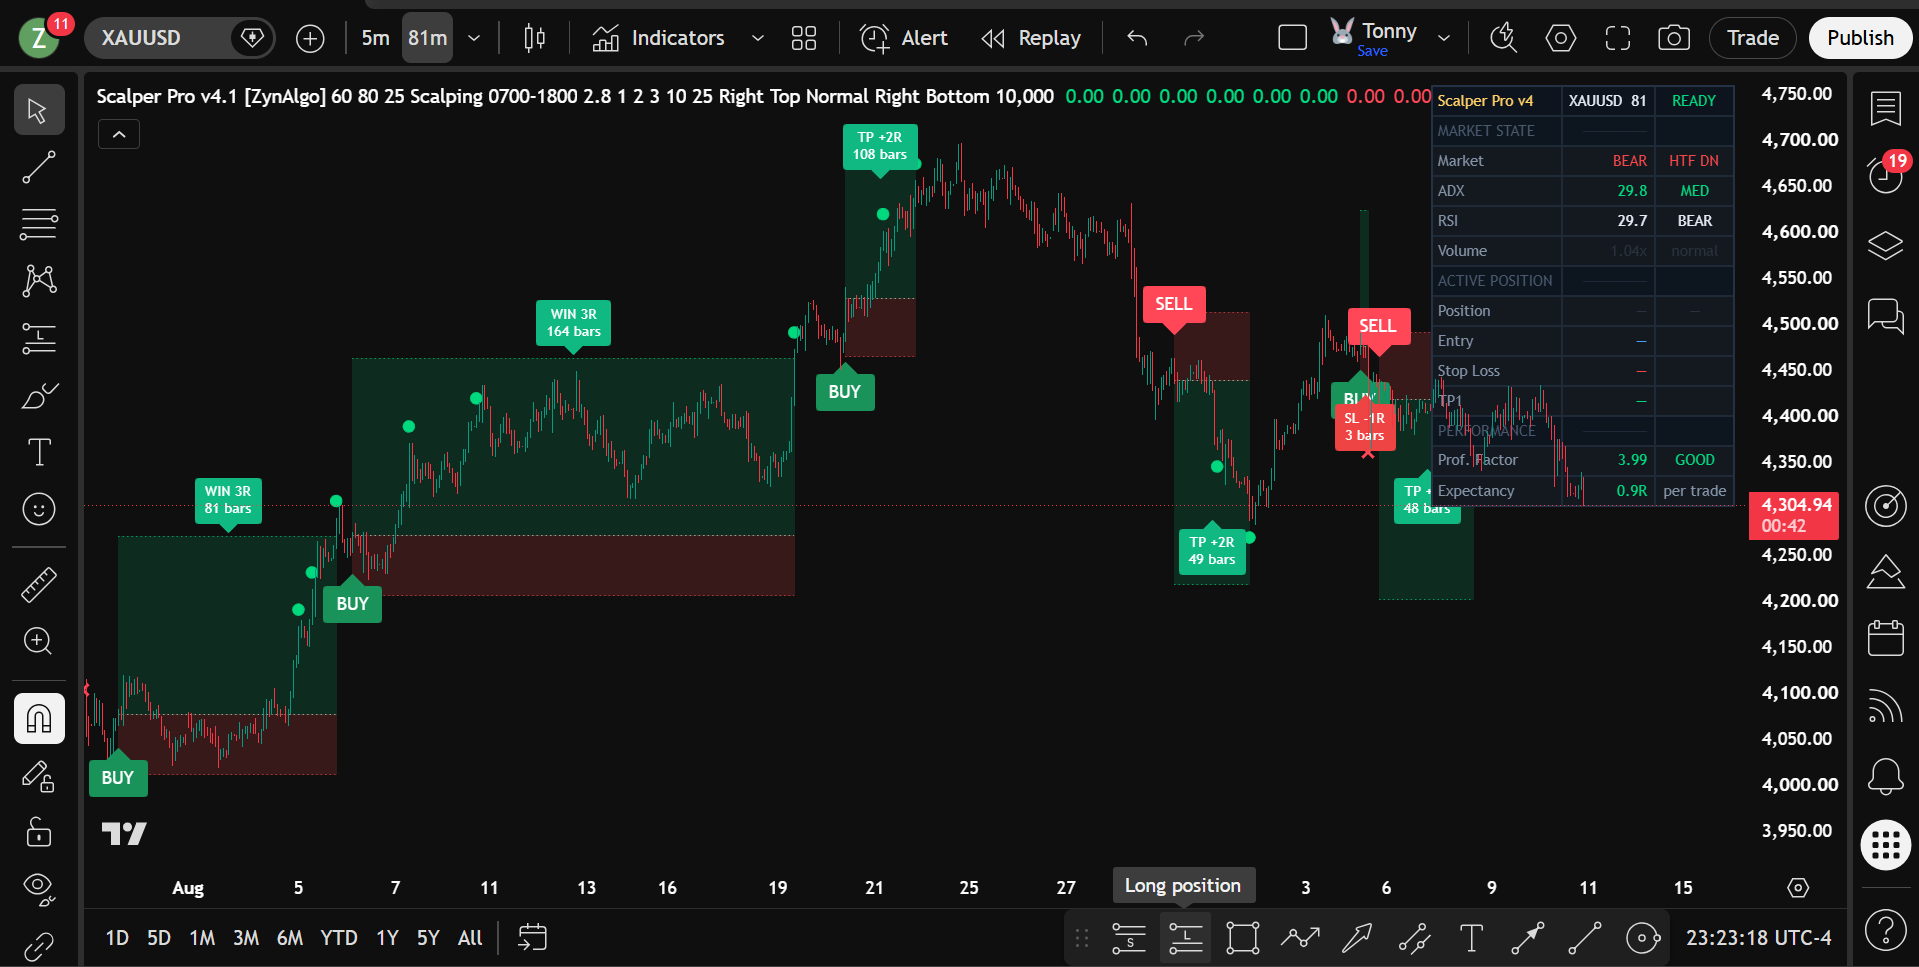
- Trade Mode ON: the trail line is hidden and a full plan appears instead - a green reward box from entry to the highest enabled target, a red risk box from entry down to the stop, dotted entry and stop lines, and result labels (WIN / TP / SL). Entry is taken at the open of the bar after the signal; the stop is an ATR multiple and the targets default to 1R / 2R / 3R. In this mode the two execution filters also start working: Stability Mode blocks a new signal while a trade is still open, and the Smart Signal Filter can force entries to alternate Buy/Sell.
- The stop trails in steps: once TP1 is reached the stop moves up to entry (break-even), and once TP2 is reached it moves to TP1. The dotted stop line always shows the level actually in force, so a trade that runs into profit can no longer come back for a full loss.
- The boxes trim on exit: while a trade runs, the boxes extend with price. When it closes, the reward box shrinks to the best target actually reached - entry level if none was - and its right edge snaps back to the bar where that target was hit, so the chart history shows what the trade really did rather than what it was projected to do.
- The dashboard: in Trade Mode a panel tracks the internal simulation - Trades taken, Win Rate, and the W / L split - so you can see how the current settings would have behaved on the visible history. Its corner and text size are both inputs.
Settings at a glance
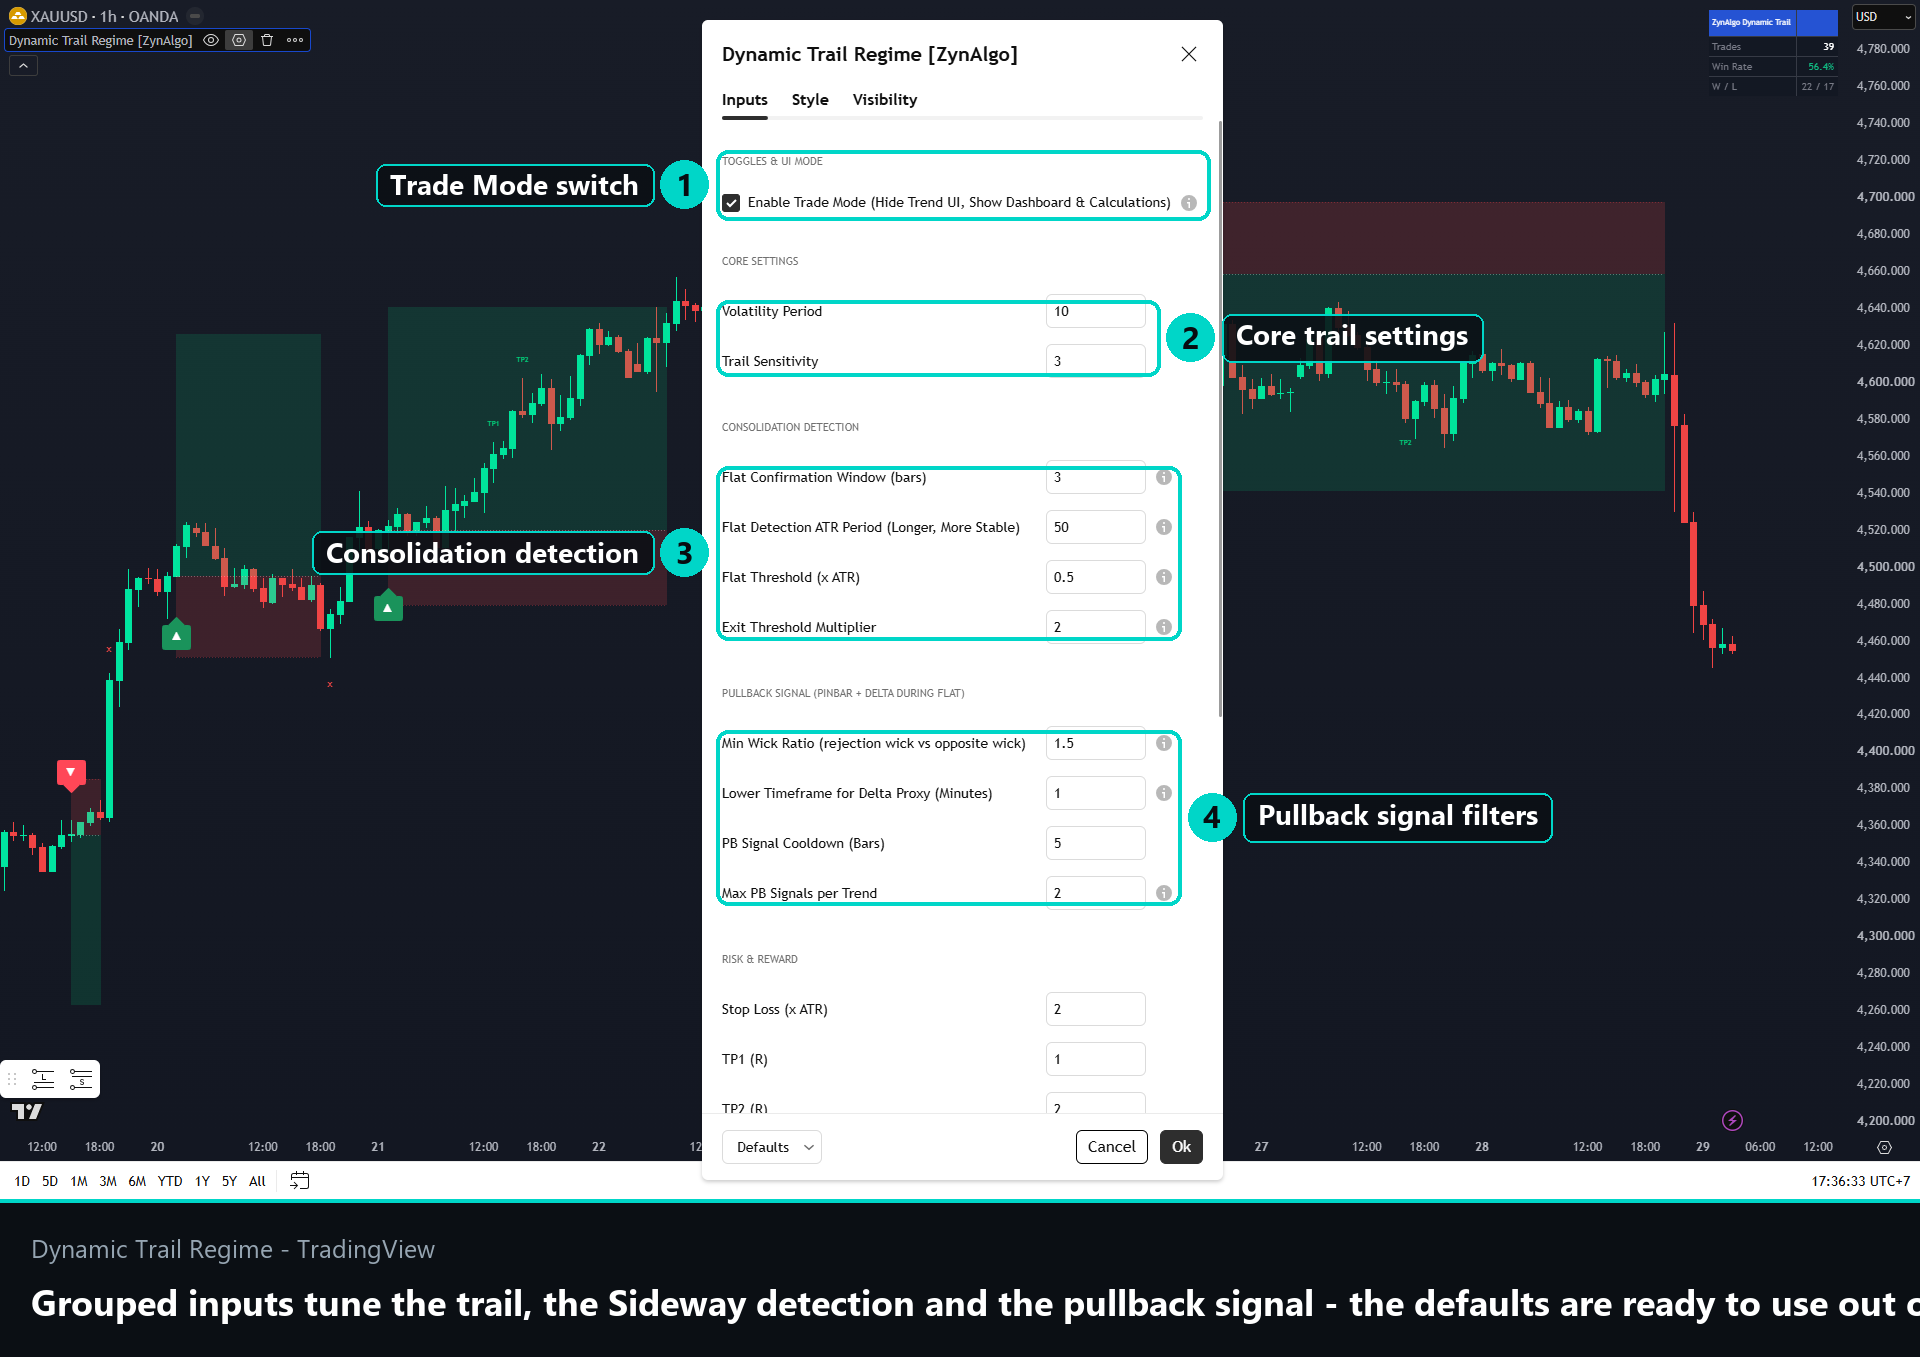
Every input is grouped so it is quick to tune. Toggles & UI Mode holds the Trade Mode switch. Core Settings control the trail (Volatility Period, Trail Sensitivity). Consolidation Detection tunes the Sideway logic (confirmation window, the slower detection ATR, the flat threshold and its exit multiplier). Pullback Signal sets the minimum wick ratio, the lower timeframe for the delta proxy, the cooldown and the max signals per trend. Risk & Reward covers the ATR stop, the three R-based targets and the timeout. Execution Filters and Signal Settings turn Stability Mode / Smart Filter and the on-chart labels on or off, and Display toggles the position box and result labels and sets the dashboard corner, the dashboard text size and one shared marker size for every on-chart mark. The defaults are ready to use out of the box.
Who this is built for
- Trend-followers who want a single, unambiguous regime colour instead of juggling several trend tools.
- Pullback and mean-reversion traders who only want to act after a rejection candle inside a genuine range, with order-flow agreement.
- Discretionary traders who like a clean context map (Trade Mode off) and a full risk-planned overlay (Trade Mode on) in the same indicator.
- Multi-timeframe traders reading the regime on a higher timeframe while timing pullbacks on a lower one.
The current bar values (trail, delta, an open trade) update until the bar closes; closed bars do not change. The Win Rate and W/L figures come from an internal, non-executed simulation and are a study of the settings on past data, not a broker report - and the delta reading is a simulated proxy, not genuine order-flow. This indicator does not guarantee any trading result. Always combine it with your own analysis and sound risk management.
Browse the full lineup here: Browse the ZynAlgo marketplace
- Dynamic Trail Regime v1Sep 17, 2026