FVG X-Ray Sniper
A fair value gap tells you where price skipped. FVG X-Ray Sniper [ZynAlgo] shows you what actually traded inside it, so a gap becomes a level you can read instead of just a coloured box.
Key benefits
- Only the gaps that matter - each fair value gap is measured against recent volatility, so tiny, meaningless gaps are filtered out before anything is drawn.
- See inside the imbalance - a lower-timeframe volume profile is rebuilt inside every gap, with its point of control marked, so you can tell where the interest sits within the gap.
- A chart that cleans itself - a gap box disappears the moment price trades through it, leaving only the imbalances that are still open.
How it works
The tool detects three-bar fair value gaps, then reconstructs each gap from lower-timeframe data into a mini volume profile split across price bins, tagging the bin where the most volume traded as the point of control. Full walkthrough in the Manual.
What's included / Platforms
- TradingView indicator, Pine Script v6, added to your TradingView username once access is granted. Released to ZynAlgo VIP members.
Best for
ICT and price-action traders on volume-bearing markets - futures, indices and crypto - who trade fair value gap fills and want to know where inside a gap price is most likely to react.
Get started
Browse the ZynAlgo marketplace
Disclaimer: an analysis tool, not financial advice or a signal service. It does not generate buy or sell signals and no indicator removes market risk - trade with your own plan and position sizing.
FVG X-Ray Sniper
What FVG X-Ray Sniper puts on your chart
FVG X-Ray Sniper [ZynAlgo] does one job well: it finds fair value gaps and then looks inside them. Most gap tools stop at drawing a box between three candles. This one goes a step further and rebuilds what traded inside that box from lower-timeframe data, so an empty imbalance turns into a readable level. It is a context tool - it maps structure and participation, it does not tell you when to buy or sell.
For every qualifying gap it draws:
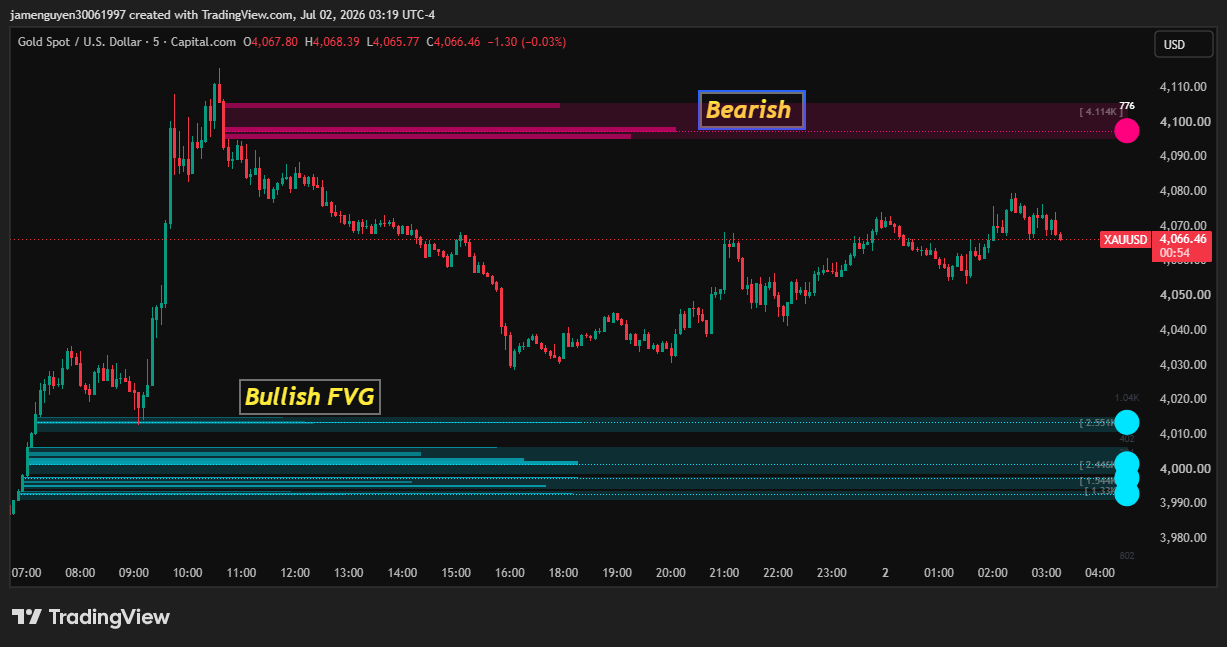
- a coloured box marking the gap, cyan for a bullish gap and magenta for a bearish one,
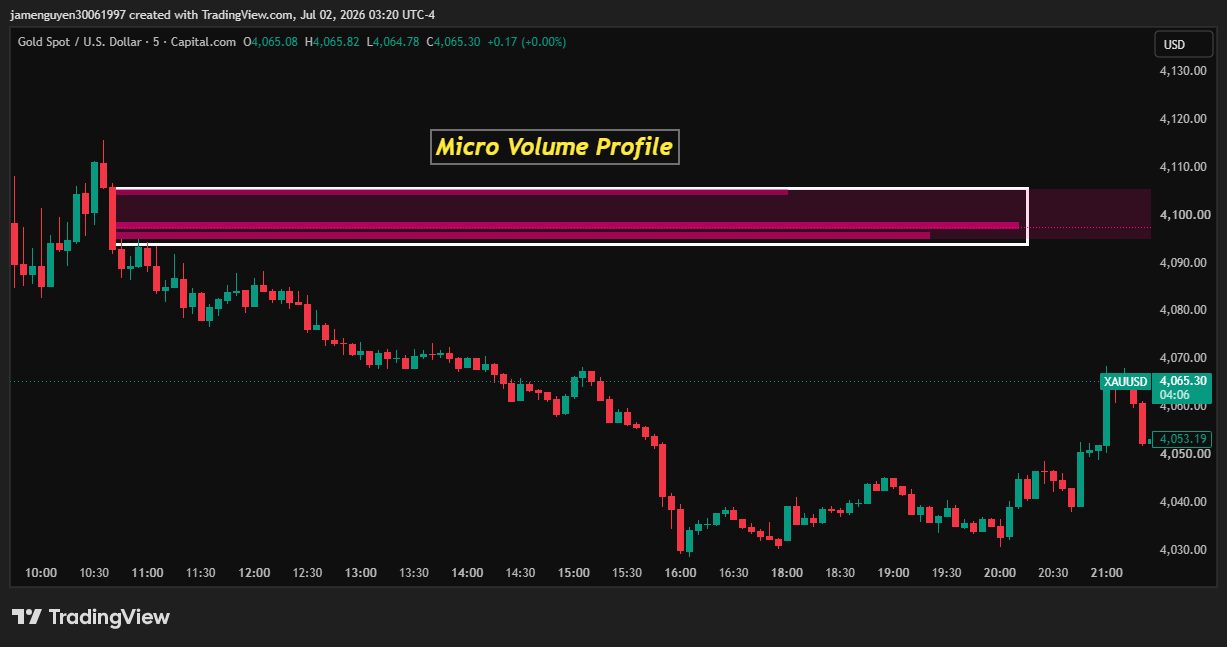
- a row of horizontal volume bars inside the box, longer where more volume traded,
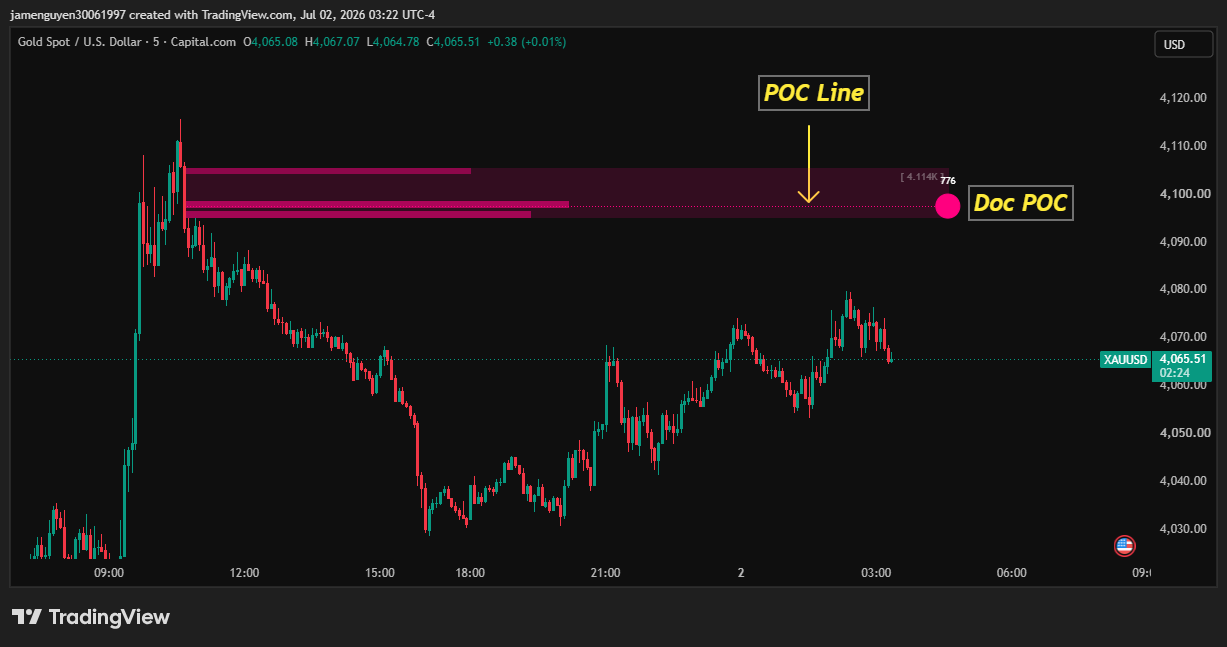
- a point-of-control line and label at the price level that saw the most volume,
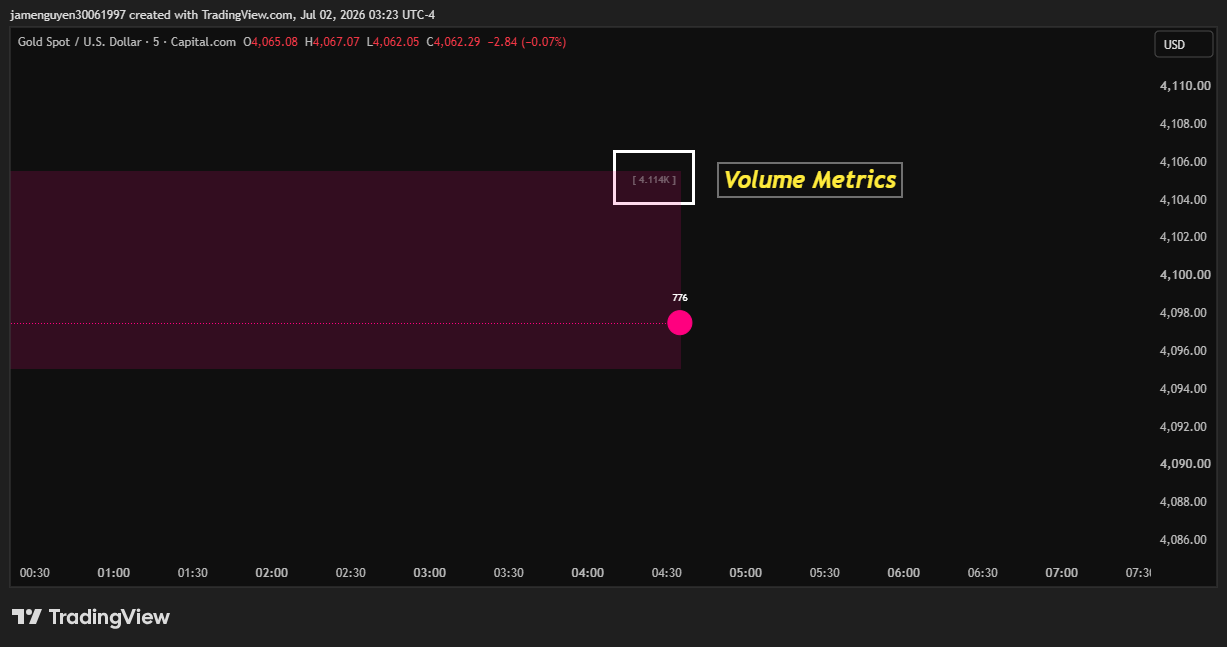
- the total volume the gap contains, printed on the box,
- and it keeps that box on the chart only until price trades through the gap.
The result on TradingView is a set of live fair value gaps that each carry their own internal map, instead of a chart full of identical empty rectangles.
The role of the volume inside the gap
The core concept is the in-gap volume profile: the distribution of traded volume across the price levels within a fair value gap, and the point of control that distribution produces. A gap on its own only tells you price moved quickly. The same gap with a point of control inside it tells you which level within it price actually did business at - the level most likely to matter when price returns.
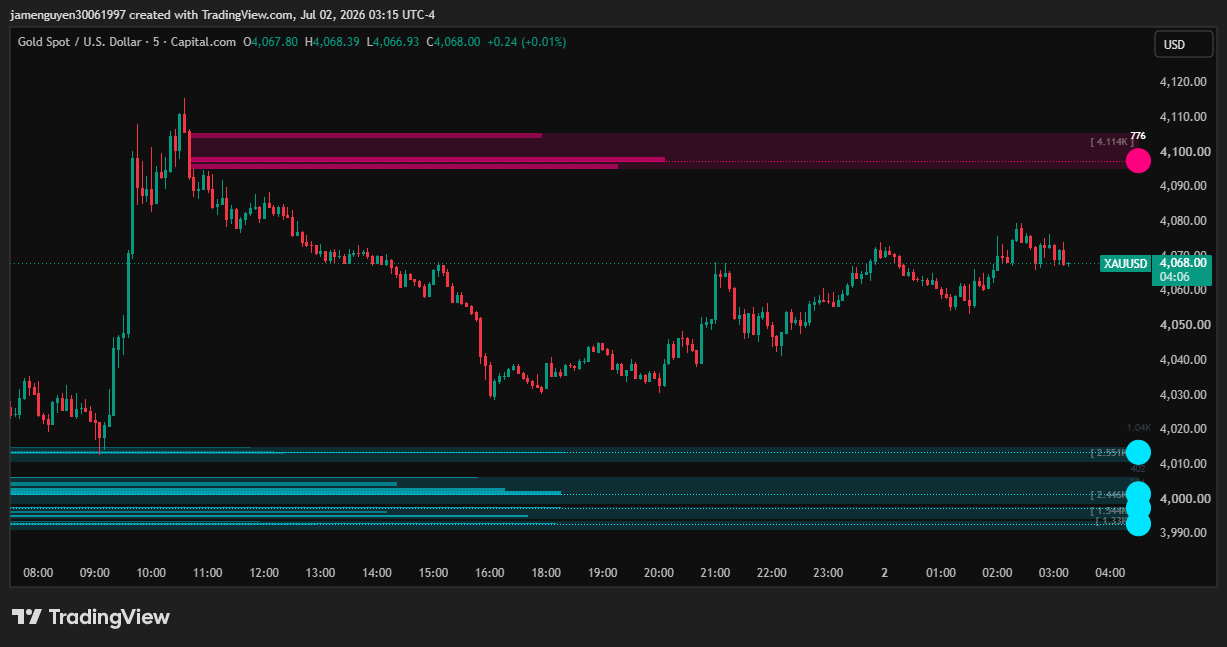
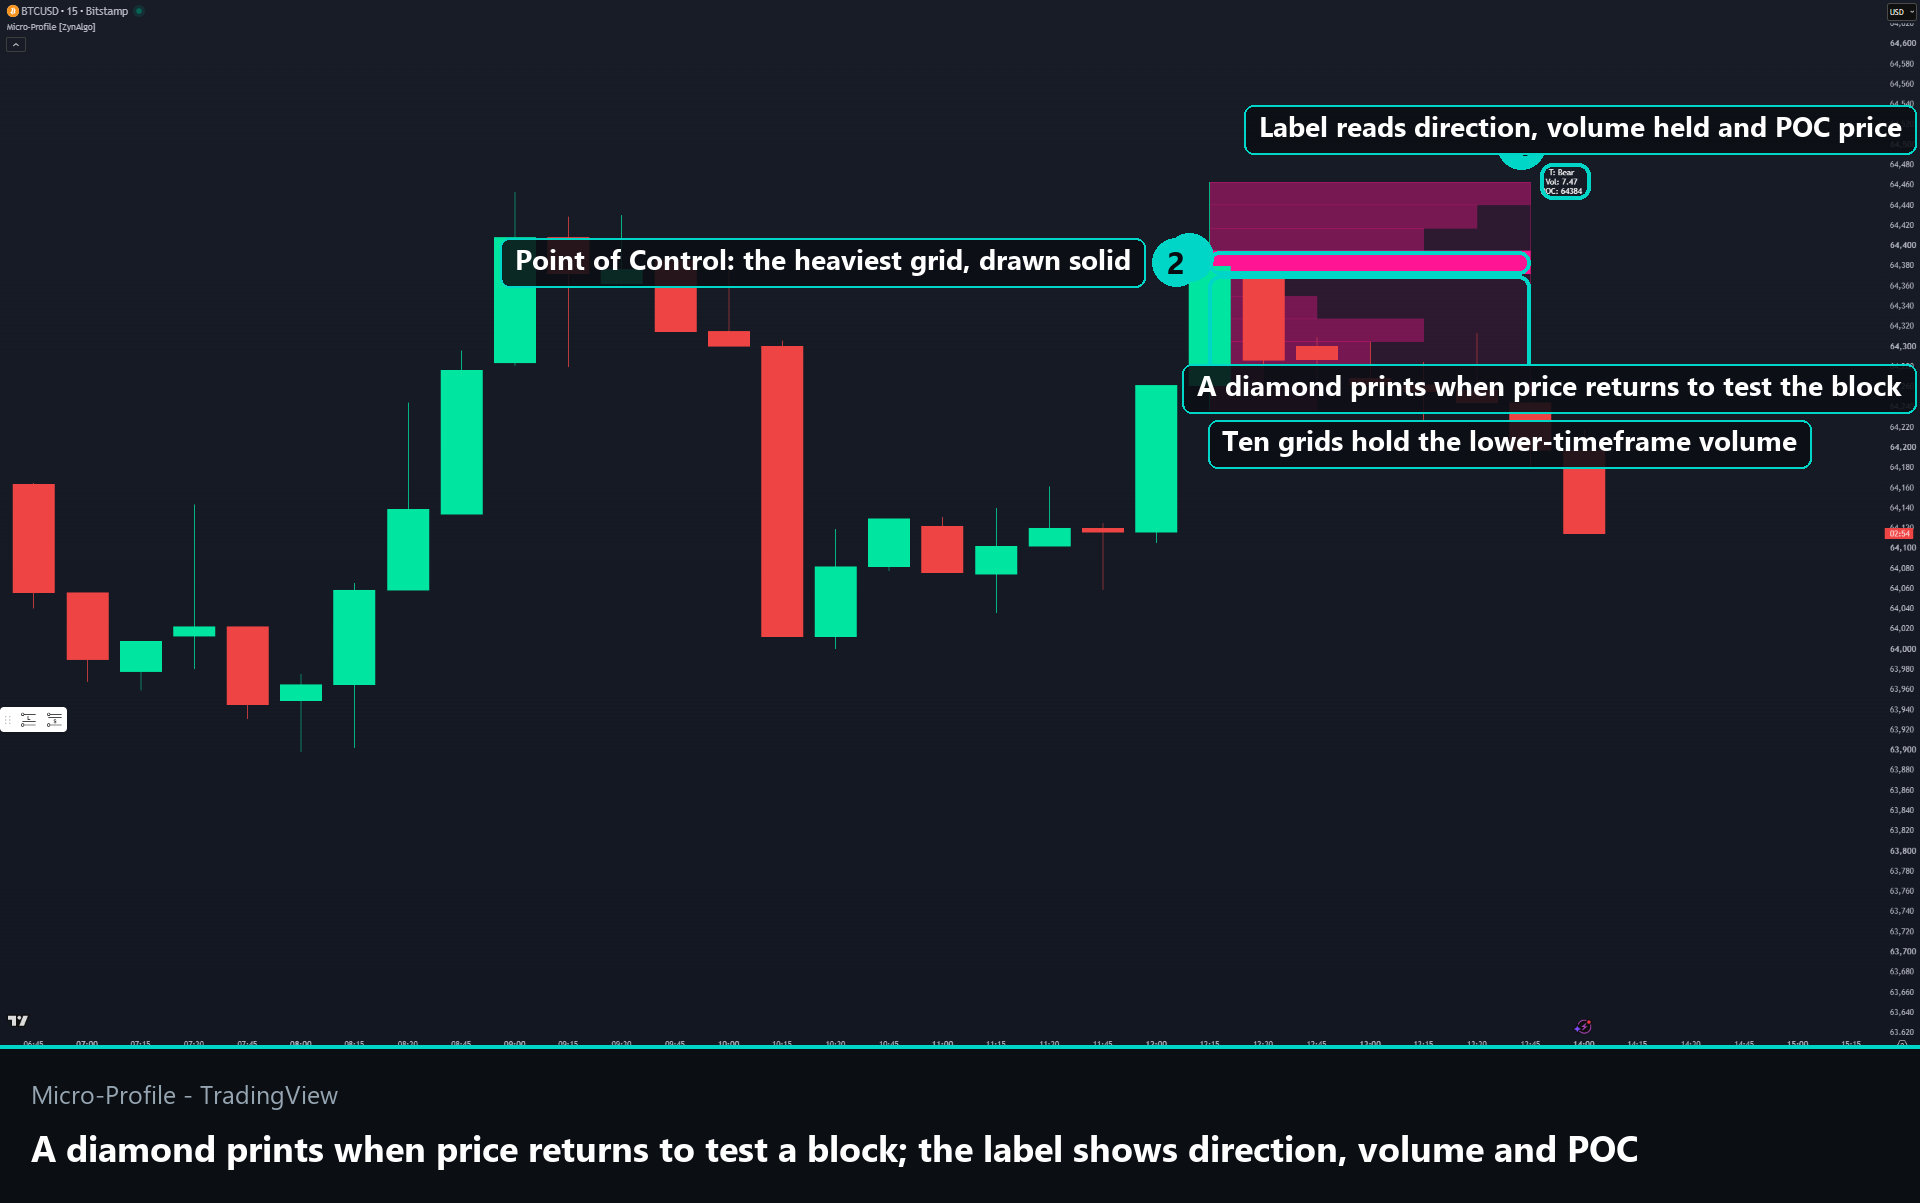
What a mapped gap looks like on the chart:
- a shaded gap box extending to the right until it is filled;
- a stack of horizontal bars inside it, each bar's length scaled to how much volume traded at that price;
- a dotted point-of-control line with a circular label showing the volume at the heaviest level;
- a total-volume tag on the edge of the box.
Common mistake: treating every gap as an equally strong magnet. A gap whose volume is spread thin is a weaker reference than one with a sharp point of control. The internal profile is exactly what lets you tell those two apart before price gets back there.
How the in-gap volume profile is defined
- Fair value gap - a three-bar imbalance. A bullish gap needs the current low to sit above the high two bars back; a bearish gap needs the current high to sit below the low two bars back.
- Significance filter - each raw gap is measured against the recent standard deviation of gap sizes, so only gaps large enough relative to normal are kept. Hairline gaps are ignored. The Gap Significance Filter setting controls how strict this is.
- Lower-timeframe rebuild - the tool pulls closes and volume from a lower timeframe and distributes that volume across the height of the gap. By default the lower timeframe is chosen automatically from your chart timeframe; you can also set it manually.
- Bins - the gap height is split into equal price bins (15 by default, adjustable); the volume that traded in each bin sets the length of that bin's bar. The in-gap bars can be switched off if you only want the box and its point of control.
- Point of control (POC) - the bin holding the most volume is marked with a line and a label. This is the level inside the gap with the strongest participation.
- Total volume - the sum of all volume mapped into the gap, shown on the box so you can compare one gap's weight against another.
How to read the X-Ray
FVG X-Ray Sniper does not print entries. There is no arrow, no BUY or SELL label, and no stop or target logic anywhere in the tool. What it gives you is a set of gaps and, inside each, a map of where the volume sits; the trade decision stays with you.
The readings the tool produces, and what each one means:
- The point of control - the price inside a gap where the most volume traded. When price returns to the gap, this is the level within it most likely to produce a reaction.
- The shape of the profile - volume concentrated in one band points to a clear level; volume spread evenly means the gap has no obvious level to defend.
- The total-volume tag - a quick way to weigh one open gap against another. A wide gap built on little volume is a weaker reference than a tight gap built on a lot.
- An open versus a filled gap - a box still on the chart is an imbalance price has not yet returned to; once price trades through the gap, the box is removed automatically.
Context worth reading alongside those levels:
- price returning into a gap and stalling exactly at its point of control - the level is doing its job;
- a bullish gap and a bearish gap sitting close together - an area price skipped in both directions, worth extra caution;
- only the most recent gaps are kept on the chart, so the map always reflects current structure rather than old, already-filled imbalances.
Who benefits most from FVG X-Ray Sniper
- ICT and smart-money traders - you already trade fair value gaps and want to know where inside a gap the real interest is, not just its outer edges.
- Price-action and gap-fill traders - you work from imbalances and want a volume-based reason to expect a reaction at a specific level.
- Volume-aware traders on futures, indices and crypto - markets that report real volume, where the internal profile is most meaningful. On spot FX the feed reports tick volume, so treat the profile as a rough proxy there.
A gap is a reference, never a promise. The value is in knowing which gaps have a clear level inside them and which do not, then working your own setups around the ones that do.
Browse the ZynAlgo marketplace
Risk note: FVG X-Ray Sniper [ZynAlgo] is an analysis tool. It does not place trades, it does not predict what price will do next, and no indicator removes market risk. Always trade with your own plan and position sizing.
- FVG X-Ray Sniper [ZynAlgo] v1Aug 13, 2026