Trend Mini Dashboard
Built for traders who want top-down trend context without clicking through five charts. ZynAlgo Trend Dashboard Mini is a multi-timeframe trend dashboard for TradingView that reports the bias of up to five timeframes in a single compact panel.
Key benefits
- See agreement instantly - one glance tells you whether fast and slow timeframes pull the same way, or argue.
- One rule, every timeframe - the same classification runs on every row, so your top-down read stops depending on memory and mood.
- Fewer pointless flips - an adjustable neutral buffer reports indecision as NEUTRAL instead of flickering between states.
- A chart that shows its bias - optional candle colouring marks the bars where your timeframes actually line up.
- Alerts instead of staring - get notified when all - or a clear majority of - timeframes agree.
How it works
Each enabled timeframe is classified as BULLISH, BEARISH or NEUTRAL using your chosen mode - MA Cross, Price vs MA, or RSI - then tallied into one Overall Trend verdict. Full details in the Manual. Read the full Manual: Manual Trend Mini Dashboard.
What's included
TradingView indicator (Pine Script v6): five configurable timeframes, three signal modes, three display layouts, seven themes, six panel positions and four built-in alerts. Access is delivered to your TradingView username.
Best for
Forex, gold, indices and crypto, on intraday through swing timeframes. Best suited to traders who already have an entry method and want a consistent trend filter around it.
Get started
Add it to your chart and stop guessing whether the higher timeframes are with you. Trading involves risk; this tool provides context only and does not guarantee results.
Trend Mini Dashboard
Status panel only. This indicator does not generate BUY/SELL entries, stop-loss or take-profit levels, and does not manage trades.
What ZynAlgo Trend Dashboard Mini does differently
Most trend tools answer one question: what is the trend on the chart you happen to be looking at? This one answers a narrower and more practical question - do your timeframes actually agree with each other right now?
Rather than adding another layer of arrows to your chart, it applies one single trend rule across several timeframes at once and reports the result as a compact table.
What it tracks:
- Up to five user-selected timeframes - default M5, M15, H1, H4 and D1 - each one individually switchable on or off
- One shared classification rule applied identically to every timeframe, chosen from MA Cross, Price vs MA, or RSI
- A neutral buffer, so a timeframe sitting on the fence is reported as NEUTRAL instead of flipping back and forth
- A live tally of how many timeframes are currently bullish, bearish and neutral, plus a single Overall Trend verdict
The outcome is one small panel on your TradingView chart that tells you at a glance whether the fast and slow timeframes are pulling in the same direction - context you feed into the trading system you already use.
How ZynAlgo Trend Dashboard Mini reads multi-timeframe trend alignment
Alignment is the core concept of this tool. A move that only exists on the 5-minute chart behaves very differently from the same move when the hourly and the daily are leaning the same way. Alignment does not tell you where to enter - it tells you how much weight the current environment deserves.
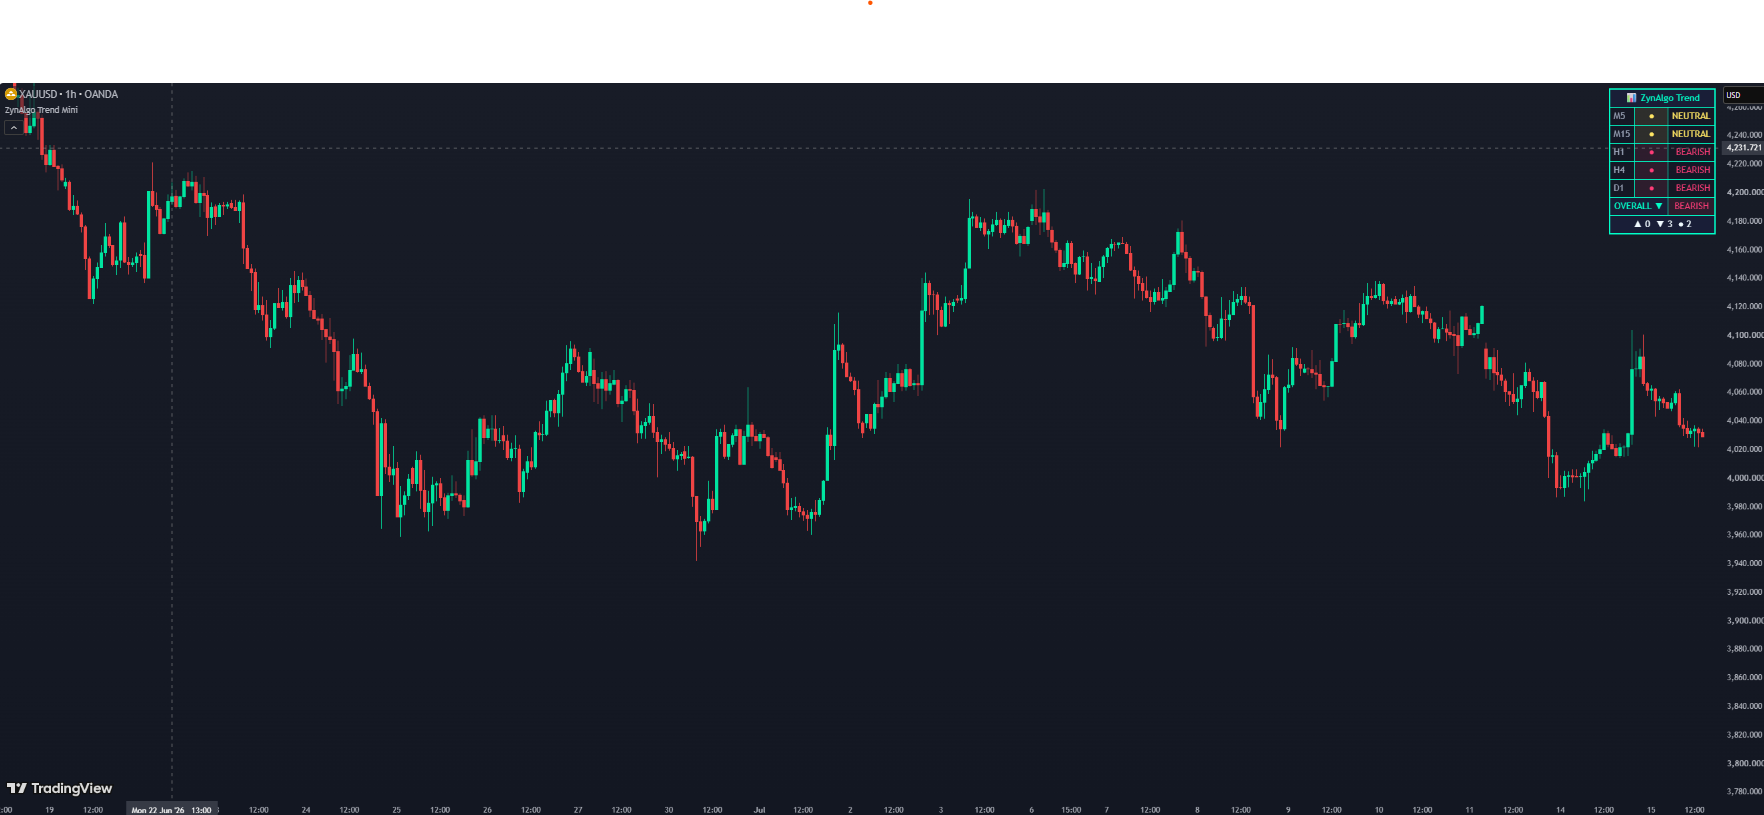
What alignment looks like on the panel:
- Full agreement - every enabled timeframe shows the same state; the environment is one-directional and simple to read
- Split reading - the fast timeframes point one way while the slow ones point the other; typically a pullback inside a larger trend, or an early turn
- NEUTRAL is a real state, not missing data - it means the timeframe is inside the neutral buffer and has no clear lean
- Rotation - timeframes usually flip from the fastest upward, so watching the order in which rows change tells you whether a shift is spreading or fading
The common mistake this addresses: traders read a single chart, see a clean setup, and size it as though the whole market agreed - when in reality only the lowest timeframe did. The mirror-image mistake is waiting for all five rows to match before doing anything; by the time every timeframe agrees, much of the move is usually behind you.
How multi-timeframe trend alignment is defined
Every enabled timeframe is pulled in separately and pushed through the same rule, so the rows are directly comparable. Each timeframe resolves to exactly one of three states: BULLISH, BEARISH or NEUTRAL.
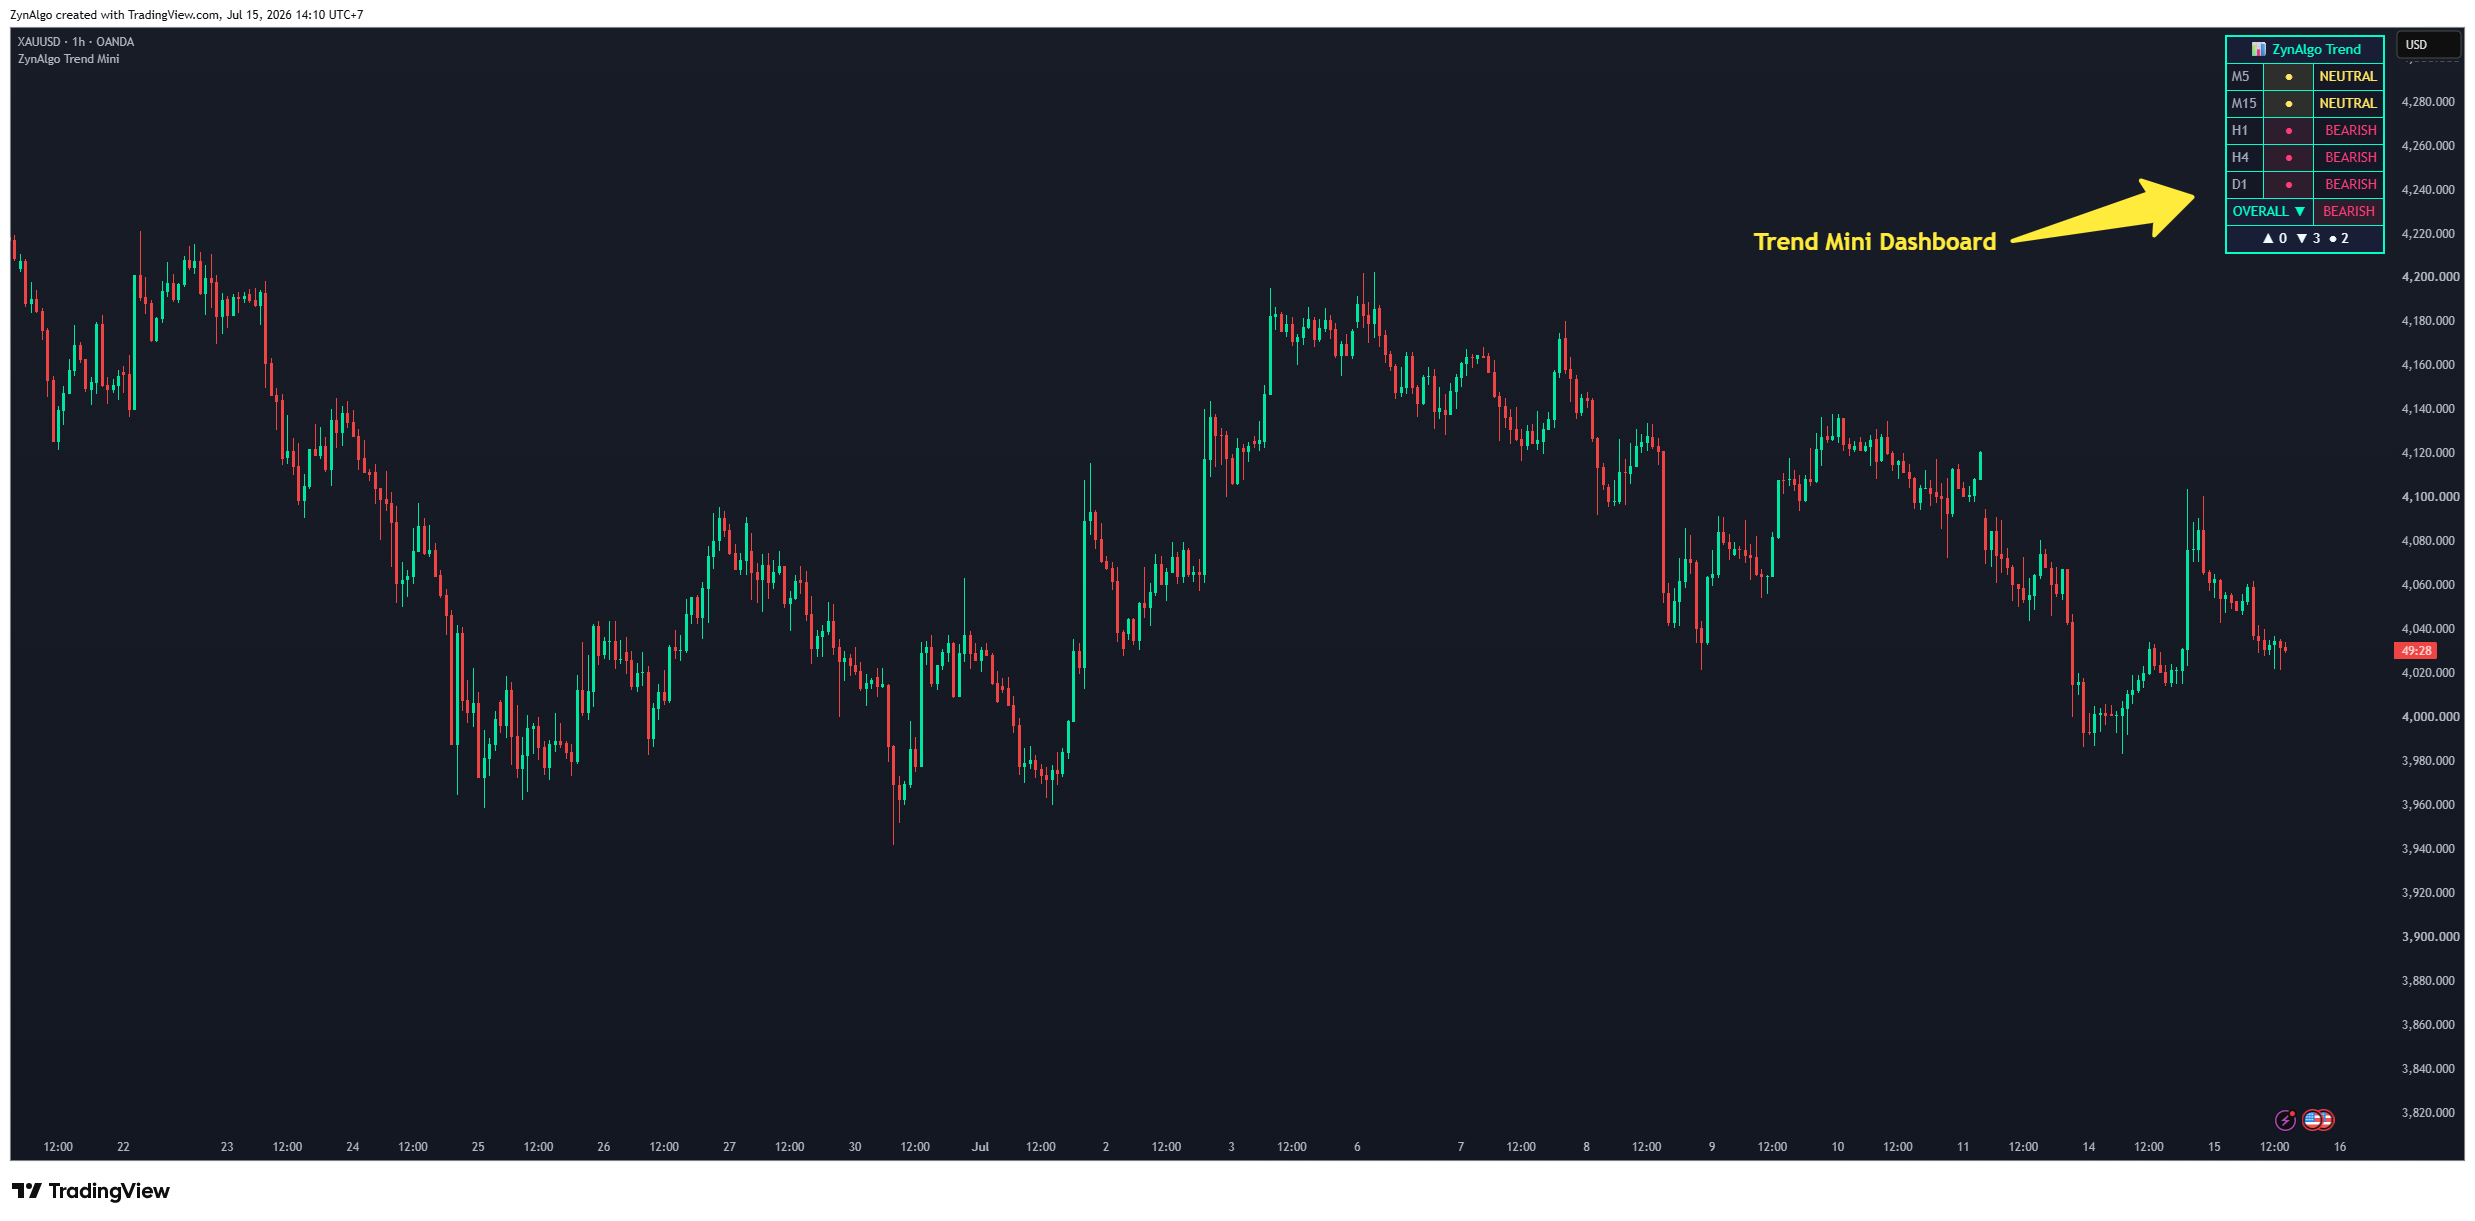
Technical components and the role each one plays:
- Signal Mode - MA Cross (default): compares a Fast MA (default 50) against a Slow MA (default 200) on that timeframe and measures the gap as a percentage of the Slow MA
- Signal Mode - Price vs MA: measures the gap between that timeframe's closing price and the Slow MA, again as a percentage
- Signal Mode - RSI: classifies by RSI (default length 14) - above the Bullish Level (default 55) is BULLISH, below the Bearish Level (default 45) is BEARISH, in between is NEUTRAL
- MA Type - EMA, SMA, HMA or WMA; controls how responsive the two MA-based modes are and has no effect in RSI mode
- Neutral Zone % - default 0.5; any gap smaller than this in either direction is reported NEUTRAL. This is the anti-flicker buffer, and it applies to the two MA-based modes only
- Score Count - the running tally shown as ▲ bullish, ▼ bearish, ● neutral, counted across enabled timeframes only
- Overall Trend - the summary verdict: BULLISH only when the bullish count is greater than both the bearish and the neutral count, BEARISH on the mirror condition, and NEUTRAL whenever no side wins outright
Disabling a timeframe removes it from the tally entirely, which changes both the Overall Trend and the alert thresholds. Fewer rows means each remaining row carries more weight.
How to trade with ZynAlgo Trend Dashboard Mini
This indicator does not produce entry signals. There are no BUY or SELL labels, no stop-loss or take-profit levels, and no trade management. It is a context layer - you read it, then apply your own system's rules. The instructions below are about reading the panel and using it as a filter, not about entries it does not generate.
Step 1 - read the panel
- Detailed mode: one row per timeframe, each showing the timeframe label, a coloured dot and the words BULLISH, BEARISH or NEUTRAL, followed by the OVERALL row and the score count
- Compact mode: the same information laid out horizontally - dot plus timeframe label - with the overall verdict and score on one line underneath
- Minimal mode: coloured dots only, plus the overall icon and a bullish/bearish count; useful when chart space matters more than detail
- Position and appearance: place the panel in any of six chart corners and pick from seven themes, with independent text sizes and border width
Step 2 - use it as a filter around your own system
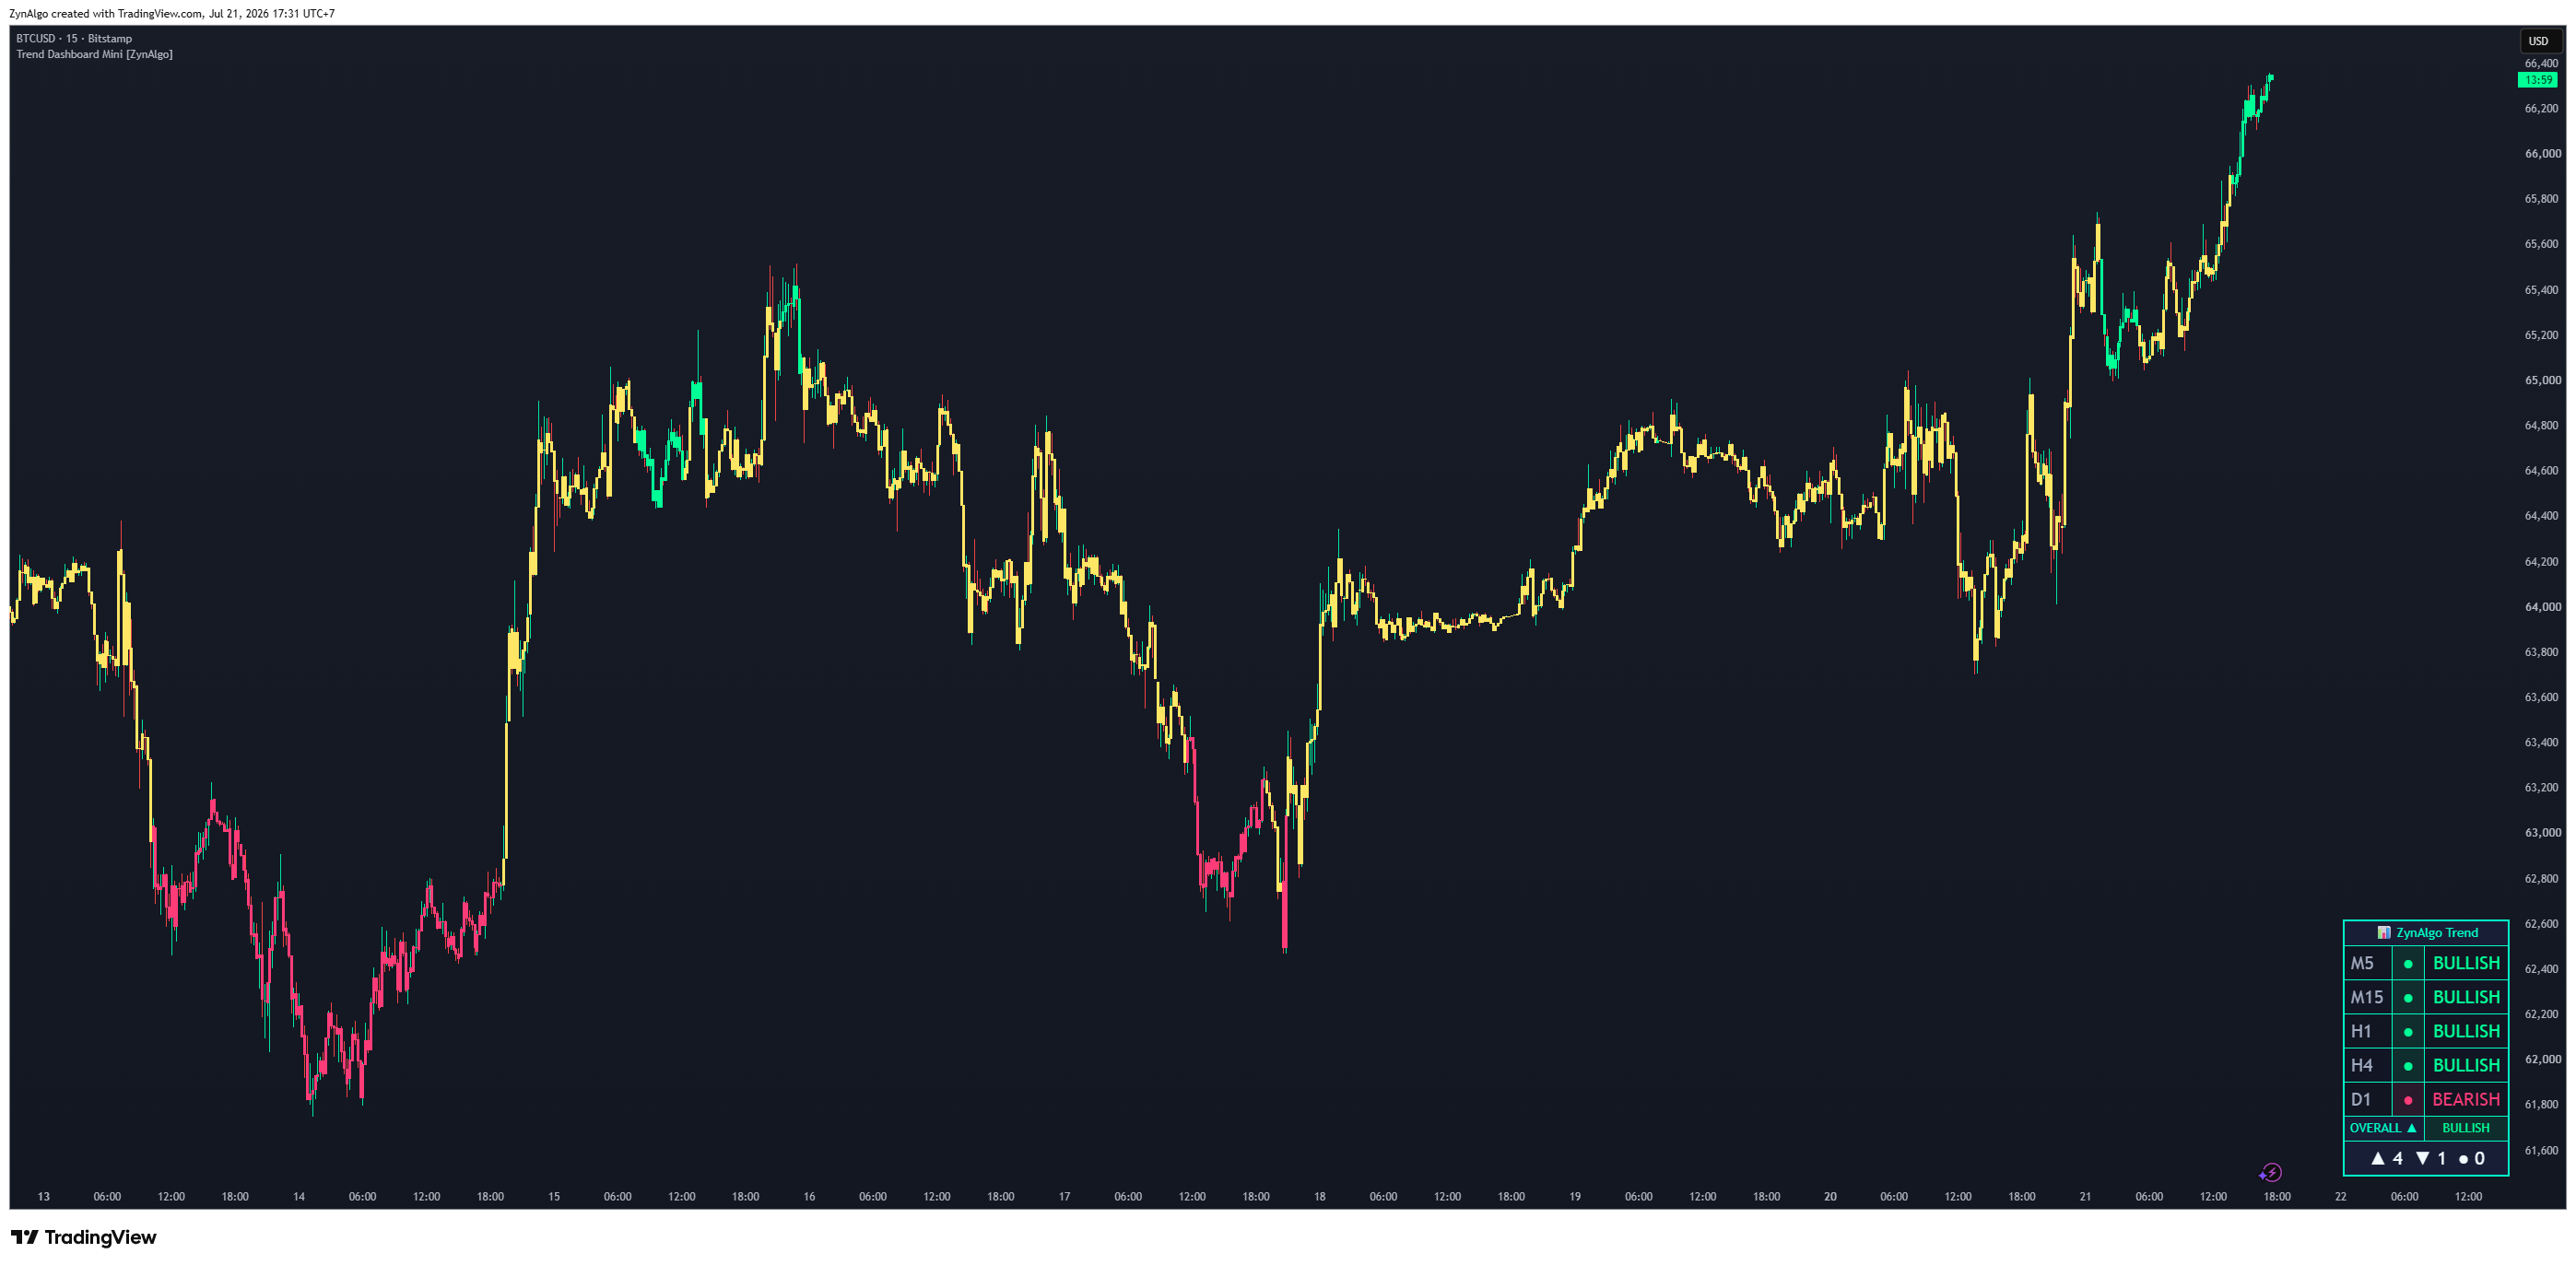
- Treat the OVERALL row as a permission state: when it reads BULLISH, your own long setups are running with the broader picture rather than against it - and the reverse for BEARISH
- Treat OVERALL = NEUTRAL as a reduced-conviction environment: the timeframes are arguing, so a setup taken here is a counter-current bet, not a trend trade
- Use the split reading deliberately - slow timeframes bullish while fast timeframes are bearish is the classic pullback shape your entry system may be built to trade
- Let the score count tell you the margin: a 3-to-2 verdict and a 5-to-0 verdict both print the same OVERALL word but describe very different conditions
Step 3 - optional automation of the reading
- Candle colouring paints the bars in the trend colour, with three modes: Overall Trend (follows the verdict), Majority Only (colours only when at least three timeframes agree) and All Aligned Only (colours only when every enabled timeframe agrees). Opacity is adjustable so it can sit behind your existing chart style
- Four alerts are available via TradingView's Create Alert dialog: All Timeframes Bullish and All Timeframes Bearish (both require at least three enabled timeframes, all in agreement), plus Majority Bullish and Majority Bearish (at least three timeframes on one side while the Overall Trend confirms that side)
- Hidden plots expose Overall Trend, bullish count and bearish count, so other tools and alert expressions can reference the dashboard's state
The table is drawn on the most recent bar and always shows the current state, not a history of past states. Higher-timeframe rows keep updating while that higher-timeframe candle is still forming. Alignment is context, never a guarantee of direction - trade your own plan and manage your own risk.
Who benefits most from ZynAlgo Trend Dashboard Mini
- Top-down traders who already work across several timeframes and want that check done consistently instead of by memory
- Intraday traders on FX, gold, indices and crypto who want to know whether the daily agrees before committing to a 5-minute setup
- Traders who already own an entry method and need a filter rather than another signal generator
- Anyone rotating through a watchlist who wants the exact same trend rule applied to every symbol, with no discretionary drift
- Traders building alert-driven routines who want to be notified when the timeframes line up instead of watching charts all session
Knowing when not to press is worth as much as knowing when to. This panel exists to make that distinction visible in one glance, so your attention goes to the conditions your strategy was actually built for.
Browse the ZynAlgo marketplace
Trading involves substantial risk. This indicator provides market context only and does not predict future price movement or guarantee any result.
- ZynAlgo Trend Mini Dashboard v1Aug 13, 2026