Footprint Pro
A breakout candle does not tell you who pushed it. Footprint Pro is a TradingView order flow indicator that reads the footprint inside every candle and only signals a breakout when aggressive buyers or sellers confirm it.
Key benefits
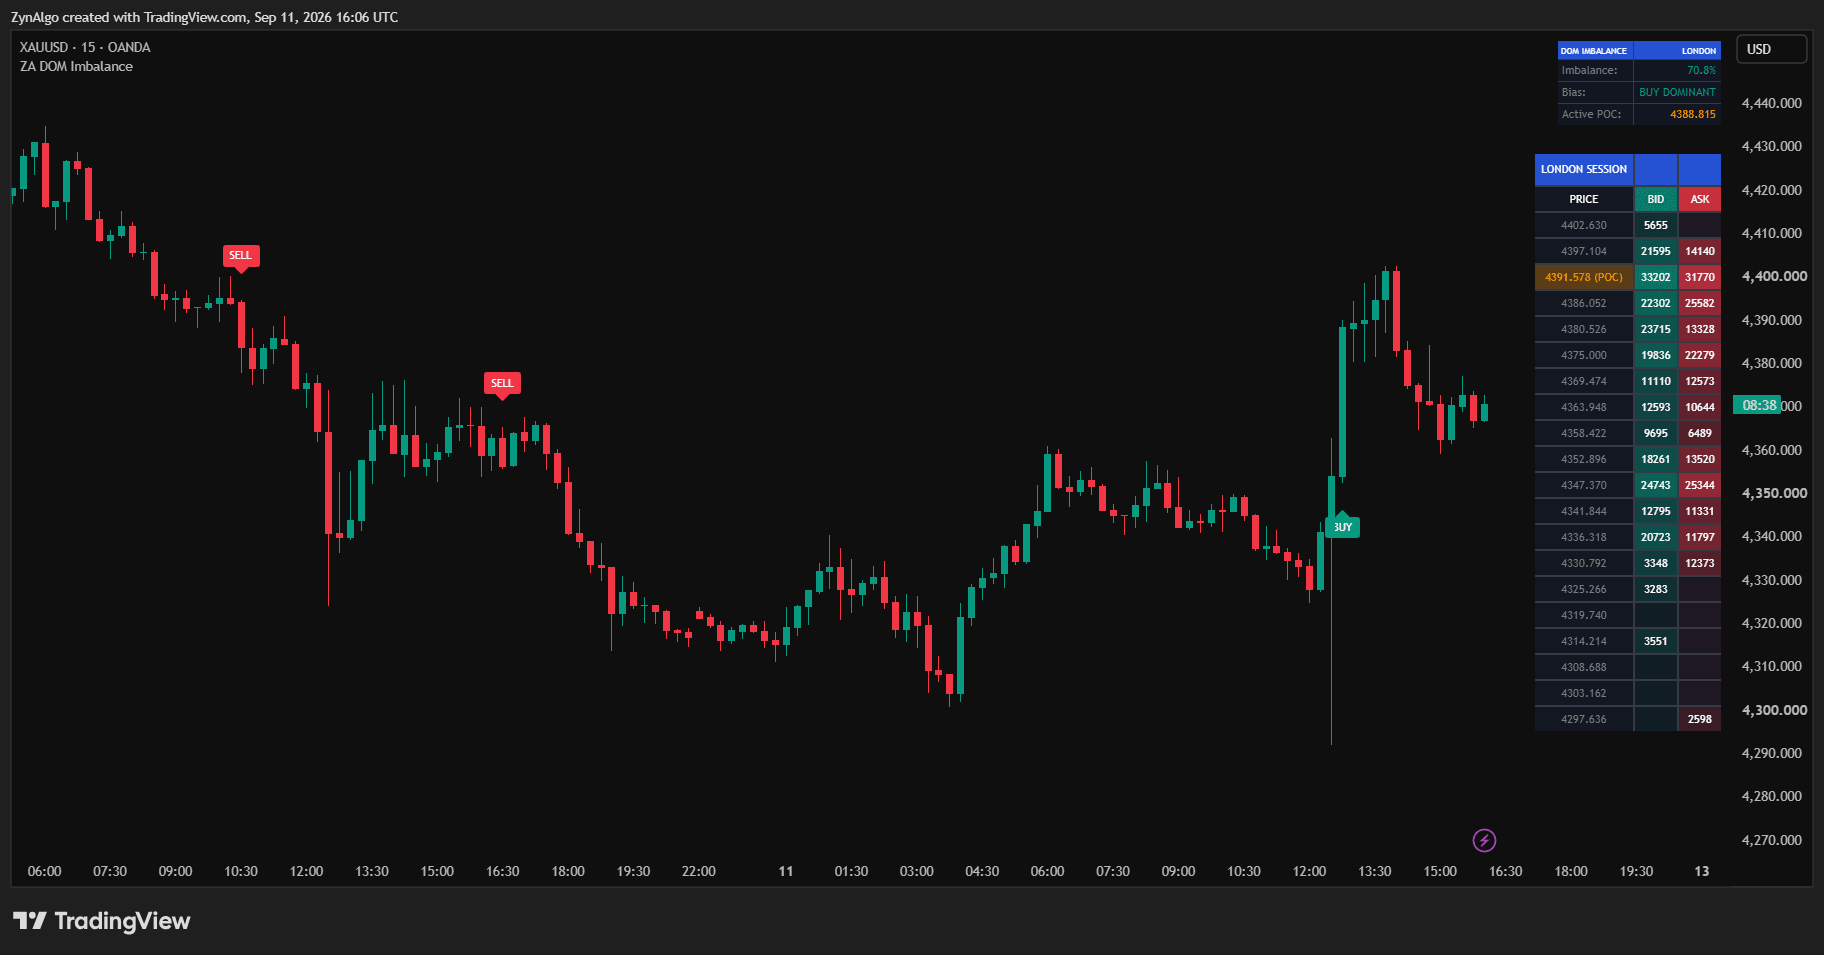
- See inside the candle: a footprint panel shows bid x ask for each price row of the latest candles, with the POC and every imbalance highlighted.
- Breakouts with proof: a BUY or SELL prints only when the break comes with a stacked imbalance or a one-sided delta surge on heavy volume, in the direction of the 200 EMA.
- Full order flow picture: delta-coloured candles, a CVD pane, the developing daily POC, stacked imbalance zones, plus absorption and divergence markers for context.
- Ready trade plan: entry, stop and TP1/TP2 drawn as a box, stop moved to breakeven at TP1, every signal explained when you hover the label.
- One simple choice: pick Conservative, Balanced or Active. The engine settings are already set for you.
- Closed-candle signals: decided on closed candles from fixed intrabar data, so signals do not repaint.
How it works
Each chart candle is rebuilt from 1-minute candles and split into 12 price rows. Buying and selling are measured row by row, giving delta, CVD, diagonal imbalances and the candle POC. A breakout of the recent high or low becomes a signal only when this reading agrees with it. Full walkthrough is in the Manual.
What's included / Platforms
- TradingView indicator, Pine Script v6, invite-only. Added to your TradingView username automatically once access is granted.
Best for
Intraday traders on Gold, major forex pairs and stock index CFDs on M5 to M15 who want breakout entries backed by order flow, and a readable footprint without a separate platform.
Get started
Browse the ZynAlgo marketplace
Disclaimer: for research and education only, not financial advice. The footprint is estimated from lower-timeframe candles, not an exchange bid/ask tape. The Win Rate, Profit Factor and Expectancy figures come from an internal, non-executed simulation over the loaded chart history, before spread and commission, not a broker report. Signals are not guarantees and no indicator removes market risk, trade with your own plan and position sizing.
Footprint Pro
User Manual
Overview
Footprint Pro is a TradingView order flow indicator that reads the footprint inside every candle and only signals a breakout when aggressive buyers or sellers confirm it. It is built for Gold, major forex pairs and stock index CFDs on M5 to M15.

1. Why these parts belong together
A breakout candle on its own does not tell you who pushed it. Footprint Pro rebuilds each candle from lower-timeframe data, splits it into price rows, and measures buying and selling inside it. The same reading drives every part of the script: the footprint panel shows it row by row, the delta colours the candle, the CVD sums it over the day, stacked imbalances mark where one side took several rows in a row, and the two signals only fire when that reading agrees with a breakout. Absorption and divergence markers use the same data to show where effort did not produce result.
2. How the footprint is built
- Each chart candle is rebuilt from 1-minute candles (5-minute on H4, 30-minute on D1, 4-hour above). Each 1-minute candle is assigned to buyers or sellers by its direction and placed in the price row it traded in. The candle range is split into 12 rows.
- This is an estimate from lower-timeframe candles, not an exchange bid/ask tape. Results depend on the volume your data feed provides for the symbol.
- Delta = buying minus selling inside the candle. CVD = delta summed through the UTC day.
- A diagonal imbalance is buying in a row of at least 300% of the selling one row lower (mirror for selling). Three or more in a row form a stacked imbalance.
- Daily POC = the price with the most traded volume so far in the UTC day.
3. The two signals
- Imbalance Breakout - the candle closes above the high of the last 20 candles, closes up, and its footprint shows a stacked buying imbalance. SELL mirrors it.
- Delta Surge Breakout - the candle closes above the high of the last 10 candles with at least 40% one-sided buying delta and at least 1.5x its average volume. SELL mirrors it.
- Trend Filter (default ON) - buy only above the 200 EMA, sell only below it.
- Signal Mode - Balanced is the default. Conservative also asks the imbalance breakout for 1.2x average volume and gives fewer signals. Active accepts 2 stacked rows and a 30% delta surge and gives more signals.
- Hover a BUY or SELL label to read the exact reason: the level that broke, the stacked rows or delta share, the volume ratio, the trend filter and the trade levels.

4. Entry, stop and targets
- Entry - the close of the signal candle.
- Stop - beyond the low (high for sells) of the signal candle and the candle before it, plus a buffer of 0.2 ATR. R = entry to stop. Setups with a stop wider than 2.5 ATR are skipped.
- Targets - TP1 = 1R and TP2 = 2R are on by default. TP3 = 3R is optional.
- Stop management - Move Stop to Breakeven at TP1 (default ON). With TP3 enabled the stop moves to TP1 at TP2.
- Time limit - a trade still open after 200 candles closes at the candle close.

5. Order flow context
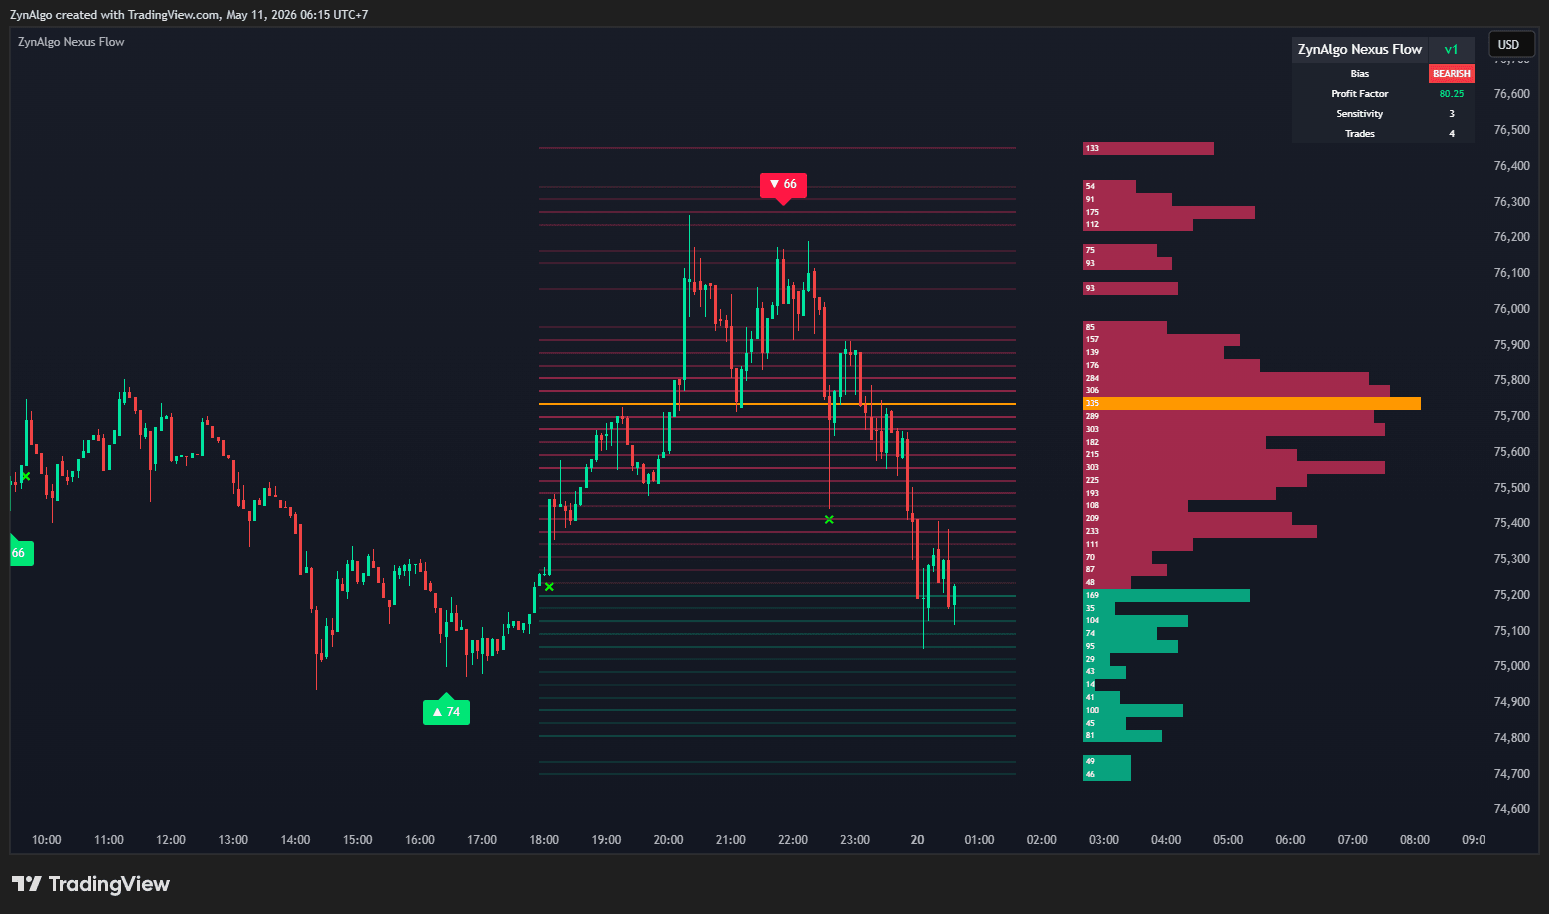
- Footprint panel (bottom-left) - one column per recent closed candle, top row = candle high. Each cell shows bid x ask. The gold cell is the candle POC, cyan or pink text marks an imbalance. Hover a cell for its price range. You can switch to cells drawn over the candles, or hide it.
- Delta candles - bright green or red for strong one-sided candles, dim for mild ones.
- Imbalance zones - cyan or pink bands left by stacked imbalances, removed when price retests or breaks them.
- Absorption (diamond) - heavy selling at a fresh low (or buying at a fresh high) that did not move price further.
- Delta divergence (triangle) - price broke the last swing but CVD did not confirm it.
- Absorption and divergence are context markers, not trade signals.
6. Dashboard
- Order flow - candle delta, CVD direction, stacked imbalance, daily POC and how many candles have intrabar data.
- Active position - direction, setup, entry, stop and targets.
- Performance (Sim) - Trades, Win Rate, Profit Factor and Expectancy, overall and per signal type. A breakeven exit counts as half a win.

7. Signal filters
- Stability Mode (default ON) - no new signal while a trade is open.
- Smart Signal Filter (default OFF) - signals must alternate direction.
- Session Filter (default OFF) - optional trading window in UTC. Open trades are still managed outside it.
8. Alerts
- BUY Signal / SELL Signal - JSON message with symbol, action, entry, stop, TP1-TP3, timeframe and ATR for webhook use.
- Any Signal - a short chart alert.
- Alerts fire on the same closed candle and the same filtered signal as the chart label. Create them with "Once Per Bar Close".
9. Notes
- Signals are decided on closed candles and the intrabar data of a closed candle does not change, so signals do not repaint.
- TradingView keeps a limited history of 1-minute data, so the footprint, the signals and the Performance section cover only the recent part of the chart. The dashboard shows how many candles have data.
- Use symbols with real or tick volume. Symbols without volume show no footprint and no signals.
- The Performance section is an internal, non-executed simulation over the history loaded on the chart, before spread and commission. It is a study of the settings on past data, not a broker report and not indicative of future results.
- This indicator is a tool for analysis and education, not financial advice, and does not guarantee any trading outcome. Always apply your own analysis and risk management.

10. Practical tips
- Start on Gold M15 with the default Balanced mode and hover a few labels and footprint cells.
- Want fewer, cleaner signals? Use Conservative. Want more? Use Active and expect more trades in mixed markets.
- Zoom in on a breakout candle with the panel open to see which rows the buyers or sellers took.
- Footprint Pro [ZynAlgo] v1Nov 11, 2026