Quantum Trend System
Stop guessing whether a pullback is a dip to buy or the start of a reversal. Quantum Trend System helps you read the trend first, then act only where it offers a defined entry.
Key benefits
- One clear trend state at a time - pivot structure plus volatility decide direction, flipping only on a confirmed bar close.
- Two separate pullback entries - a Fibonacci retracement entry early in a trend, plus continuation entries later on.
- Risk defined before you click - entry, ATR-based stop and up to three targets are drawn as the signal appears.
- Fewer, more deliberate signals - per-trend caps and bar spacing keep the chart from filling with noise.
- Automation-ready alerts - bar-close JSON alerts carry symbol, action, entry, SL and targets to your webhook.
How it works
The indicator builds a trend line from pivot highs and lows, pads it with ATR into a trailing stop, and treats the band between that stop and the centre line as the pullback zone. Signals fire only when price re-enters that zone and closes back with the trend. Full rules and chart examples are in the Manual.
What's included
- Pine Script v6 indicator for TradingView (invite-only).
- Trailing stop, centre line, trend zone and trend-change labels.
- STR Pullback and Continuation signals with entry, SL and TP1-TP3.
- JSON webhook alerts plus 10 alert conditions.
Best for
Trend and swing traders on indices, gold, major FX and crypto, from M15 to H4 and above.
Browse the ZynAlgo marketplace
trading involves risk; this is an analysis tool, not advice.
Quantum Trend System
The idea behind Quantum Trend System
Quantum Trend System does not try to call tops and bottoms. It is built around a single question: which direction is the market currently trending, and where inside that trend is a reasonable place to join it? Everything the indicator draws exists to answer that question and nothing else.
To do that, it reads three things off the chart:
- Market structure - pivot highs and pivot lows, which anchor the trend line the tool follows.
- Volatility - an ATR measurement that decides how far price is allowed to breathe before the trend is considered broken.
- Retracement depth - how deep price has pulled back inside the current trend, measured either against the swing that started the trend or against the trend's own centre line.
Combined on TradingView, this gives you a directional bias that only flips on a confirmed bar close, plus two clearly separated pullback entries inside that bias - each one with an ATR-based stop and reward targets already drawn on the chart.
Inside Quantum Trend System: the Pivot Point Trend Engine
The Pivot Point Trend Engine is the core of the tool. It is not a moving average and it is not a fixed channel - it is a trend line that is rebuilt every time the market prints a new structural high or low, then padded outward by current volatility. That is what makes the trend state stable during noise but still able to flip when structure genuinely changes.
Because both signal types are filtered by this engine, understanding it is the difference between reading a signal correctly and misreading it.
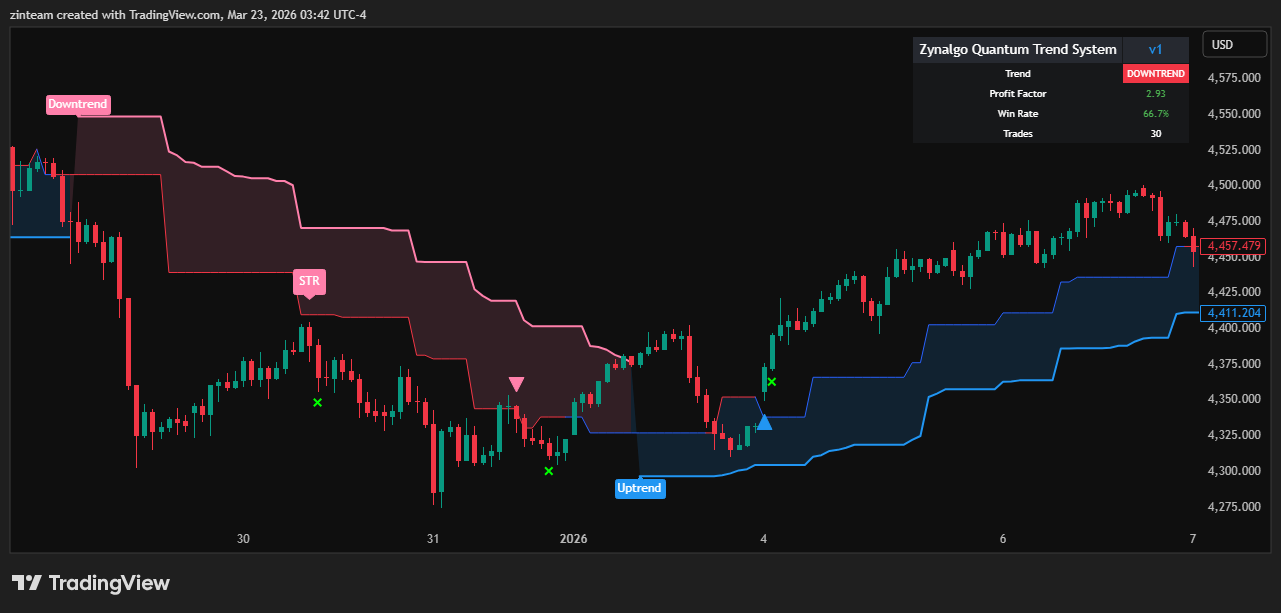
What the engine gives you on the chart:
- A single trend state at any moment - uptrend or downtrend, never both, never neutral.
- A Trailing Stop line that sits below price in an uptrend and above price in a downtrend, and only moves in the direction of the trend.
- A PP Center Line derived from pivot structure, which acts as the midpoint of the trend.
- A shaded Trend Zone between those two lines - the area price travels through when it pulls back without breaking the trend.
- An Uptrend / Downtrend label printed at the exact bar where the state flips.
The common mistake here is treating the first pullback into that shaded zone as weakness and closing out - or worse, flipping direction against the trend state. Inside this tool a pullback into the zone is not a reversal warning; it is the normal condition that has to occur before a continuation entry can even be evaluated. The trend state has not changed until a bar actually closes through the opposite band, and until that happens the engine keeps its previous direction.
How the trend is defined
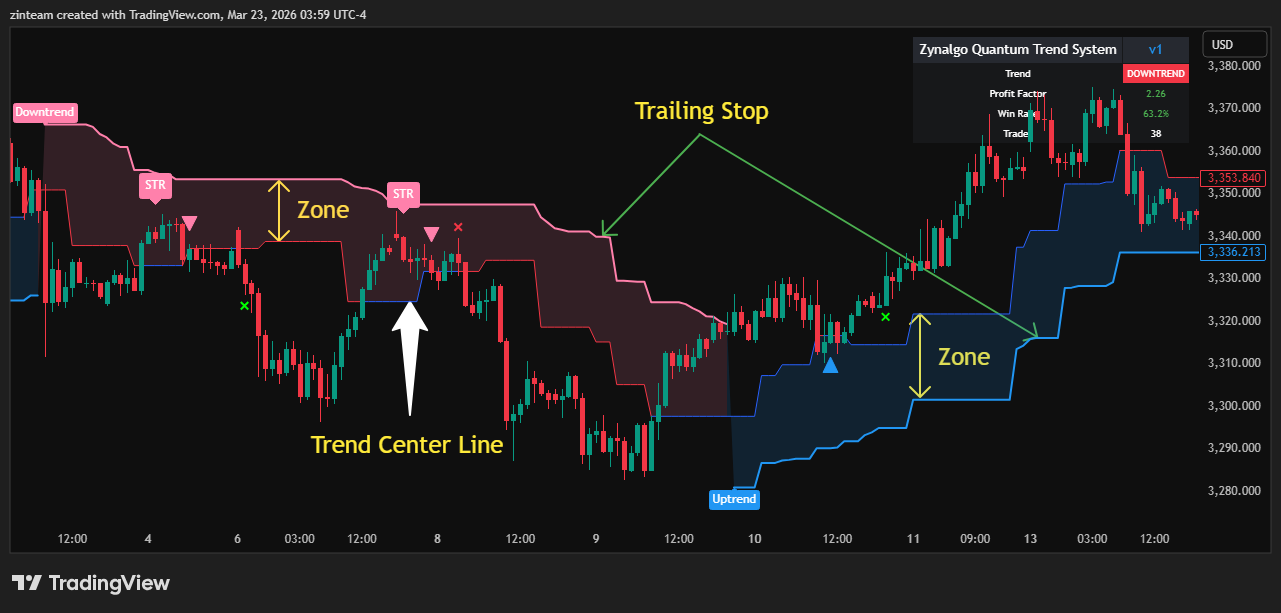
Four components build the trend state, each with a specific job:
- Pivot highs / pivot lows (Structure Depth, default 4) - locate the structural turning points. A pivot needs bars confirming it on both sides, so a lower value reacts faster but noisier, a higher value is smoother but later.
- PP Center Line - updated each time a new pivot appears. It does not jump onto the new pivot; it blends the new pivot with the previous centre, which is why the line moves in steps rather than snapping around.
- ATR (Volatility Length, default 10) x Trend Expansion (default 3.0) - sets the distance from the centre out to the upper and lower bands. Wider means the trend survives deeper shakeouts and flips less often; tighter means it flips sooner.
- Confirmed bar close - the trend only switches when a closed bar pushes past the opposite trailing band. Nothing about the trend state is decided intrabar.
- Trailing Stop - the active band on the side of the trend. It ratchets in the trend's direction and never loosens, so it doubles as the outer boundary of the Trend Zone.
When to act (and when not to)
Quantum Trend System produces two distinct entry types. Both only ever fire in the direction of the current trend state - the tool never generates a counter-trend signal.
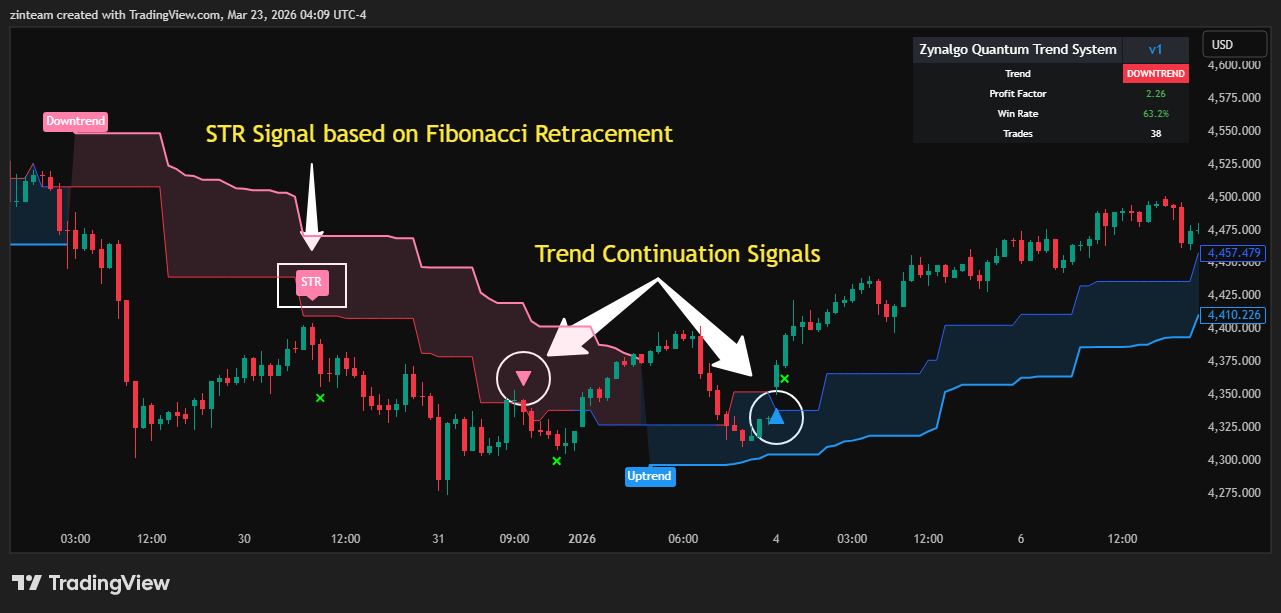
1. STR Pullback - the first Fibonacci retracement of a fresh trend
After the trend flips, the indicator waits for the first swing point in the new direction, then measures the retracement zone between 38.2% and 61.8% (STR Zone Lower / Upper) of that leg. The entry rule from there is strict:
- BUY - in an uptrend, price must first close back inside the zone, and then close above the upper edge of the zone. The label
STRis printed below the bar. - SELL - in a downtrend, price must first close inside the zone, and then close below the lower edge. The label
STRis printed above the bar. - No entry - if price closes through the far side of the zone before that breakout happens, the zone is cancelled outright and no STR signal comes from it. Wait for the next trend.
- Limit - by default only 2 STR signals are allowed per trend, with a minimum of 20 bars between them.
2. Continuation - a pullback into the Trend Zone that recovers
This one uses the shaded zone from the previous section rather than Fibonacci levels. The sequence has two stages and both must happen in order:
- BUY - in an uptrend, price must first close inside the zone (between the Trailing Stop and the PP Center Line), and then close back above the Center Line. An up triangle is printed below the bar.
- SELL - in a downtrend, price must first close inside the zone (between the Center Line and the Trailing Stop), and then close back below the Center Line. A down triangle is printed above the bar.
- Reset - if price closes beyond the Trailing Stop while the tool is waiting for that recovery, the setup is cancelled and the sequence starts over.
- Limit - by default up to 5 Continuation signals per trend, also spaced by at least 20 bars.
When a signal fires, the tool draws the trade frame for you:
- Entry - the close of the signal bar.
- Stop Loss - 2.8 x ATR(14) away from entry by default (Distance input). That distance is the risk unit, R.
- Targets - TP1 at 1R is on by default; TP2 (4.5R) and TP3 (6.5R) are off until you enable them. If you do enable them, breakeven activates once TP1 is touched.
- Lines turn dashed and the label updates when a level is hit, so you can read the outcome without scrolling back.
When not to act: the two signal counters are independent, so an STR signal and a Continuation signal can appear closer together than the 20-bar spacing suggests. Treat clustered signals as one idea, not two, and remember every trade still needs your own position sizing and risk management - the indicator sizes nothing for you.
Who should use Quantum Trend System?
This tool suits you if you already prefer to trade with the trend rather than against it:
- Trend and swing traders who want to join a move on a pullback instead of chasing breakouts.
- Traders on liquid instruments with clean structure - indices, gold, major FX pairs, large-cap crypto.
- Intraday and swing timeframes alike; the pivot logic works the same way on M15 as on H4, only the pace changes.
- Anyone who wants entry, stop and targets defined at signal time rather than improvised after entry.
- Automation users - the tool fires a JSON alert on bar close containing symbol, action, entry, SL, TP1-TP3, timeframe and ATR, plus separate alert conditions for each signal type.
It is a poor fit if you trade mean reversion, hunt exact turning points, or need signals that act before a bar closes - every decision this tool makes waits for a confirmed close, by design.
The point is not to catch every move. It is to sit out the moves where the trend is unclear, and to have a defined plan on the ones where it isn't.
Browse the ZynAlgo marketplace
Trading involves risk. Quantum Trend System is an analysis tool, not financial advice, and past chart behaviour does not guarantee future results.
- Quantum Trend System v1Aug 13, 2026
Why trend pullback entries get stopped out before the move resumes
You enter a pullback in the direction of the trend and get stopped out, only to watch the move resume minutes later. This article explains how to identify when a pullback stays inside the trend structure and when it actually breaks it.
Why trend pullbacks stop you out before the move continues
You spot the trend, wait for a pullback, enter, and get stopped out as price drifts deeper than expected before finally resuming. Quantum Trend System frames pullback entries around structure and volatility, not guesswork.