Session Lite
Session boxes tell you when the market moved. Session Lite [ZynAlgo] also tells you where the volume went while it was moving, so a session leaves behind a level you can actually justify.
Key benefits
- Four sessions, one clean chart - Asia, London, NY AM and NY PM, each with its own hours, colour and on/off switch.
- Levels that outlive the session - once a session closes, its high, mid and low keep extending to the right as reference.
- A volume anchor per session - the POC line marks the midpoint of that session's heaviest-volume bar and re-anchors live.
- Participation at a glance - the dashboard prints total volume and net delta for every session, colour-coded by side.
How it works
Each session is tracked in its own exchange time, with optional DST handling for London and New York. While a session runs, its high and low lines expand bar by bar and the POC moves whenever a heavier bar prints. When the session ends, its high, mid and low are frozen and carried forward. Full walkthrough in the Manual.
What's included / Platforms
- TradingView indicator, Pine Script v6, added to your TradingView username once access is granted. Released to ZynAlgo VIP members.
Best for
Intraday traders who work session by session on volume-bearing markets - futures, indices and crypto - and want session levels plus a participation read without opening a second chart.
Get started
Browse the ZynAlgo marketplace
Disclaimer: an analysis tool, not financial advice or a signal service. It does not generate buy or sell signals and no indicator removes market risk - trade with your own plan and position sizing.
Session Lite
What Session Lite puts on your chart
Session Lite [ZynAlgo] does one job: it separates the trading day into the four sessions that actually change behaviour, and records what happened inside each one. It is a context tool - it maps structure and participation, it does not tell you when to buy or sell.
For every session it keeps track of:
- the running high and low, drawn as two lines that widen as the session develops,
- a shaded fill between them so the session block reads at a glance,
- the price level where the heaviest single bar of that session traded,
- the total volume transacted, and the net direction of that volume,
- and, once the session is over, the high, mid and low left behind as reference levels.
The result on TradingView is a chart where each session carries its own boundary, its own volume anchor and its own participation summary, instead of one undifferentiated 24-hour range.
The session footprint explained
The core concept is the session footprint: the combination of a session's boundary, its POC and its volume balance. A session high on its own tells you where price stopped. The same high next to a POC and a net delta figure tells you whether that move had participation behind it.
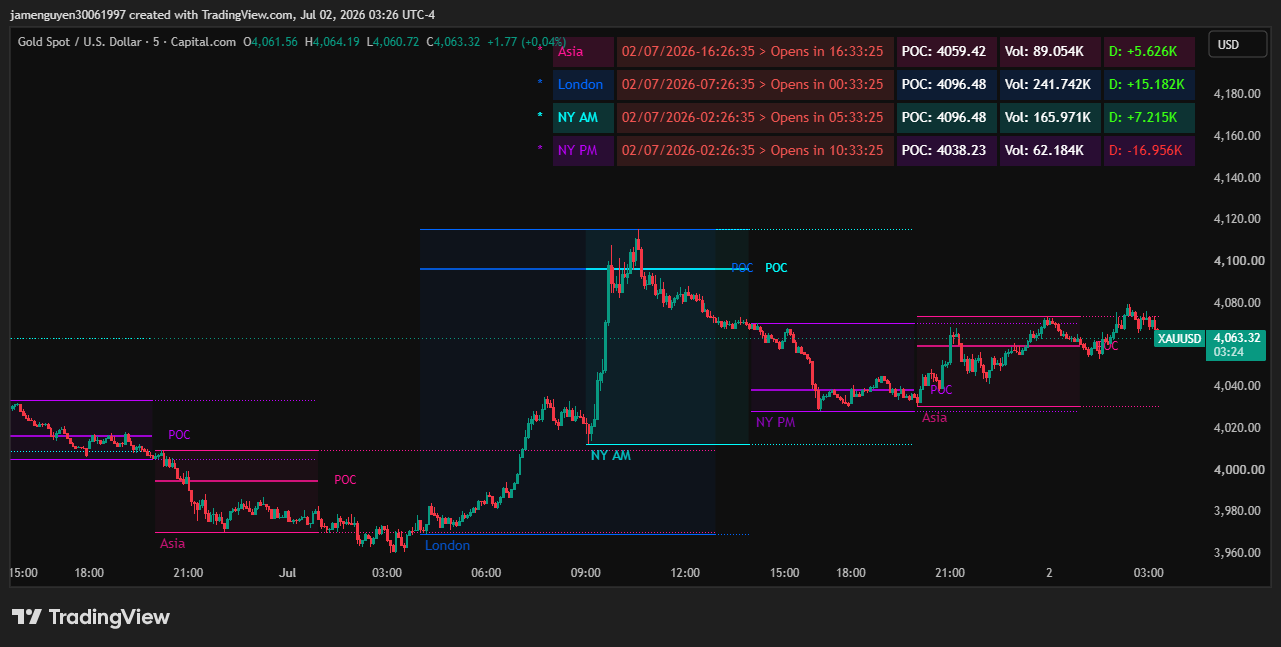
What a completed session footprint looks like on the chart:
- two horizontal lines marking the session high and low, with a shaded fill between them;
- a session name label sitting under the block;
- a POC line with a "POC" tag, drawn at the midpoint of the heaviest-volume bar of that session;
- after the close, three extended lines - high, mid and low - carried to the right of the chart;
- a row in the dashboard holding that session's POC, total volume and net delta.
Common mistake: treating every session boundary as equally important. A session that closed on thin volume leaves a level with very little behind it. The volume and delta columns exist so you can tell those two cases apart before you trade the level.
How the session footprint is defined
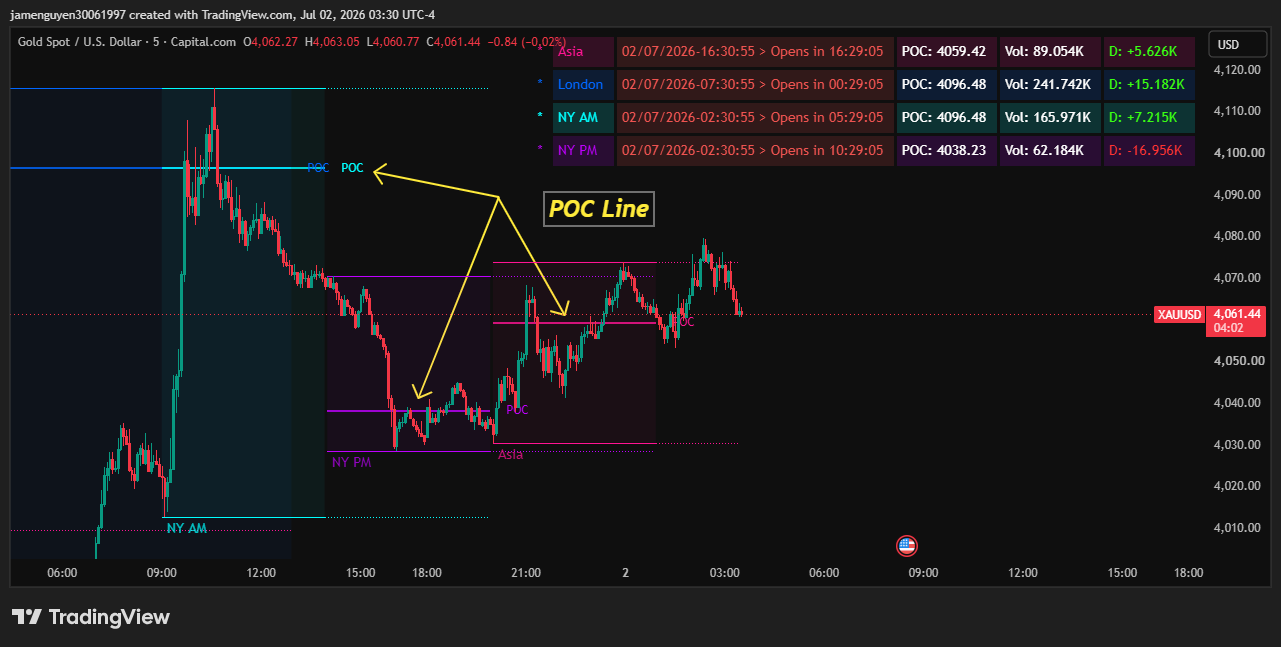
- Session windows - four independent sessions (Asia, London, NY AM, NY PM). Each has its own enable switch, display name, start and end hour, and colour. Hours are read in the session's own time, and separate DST switches for London and New York keep the windows aligned through clock changes.
- Live boundary - from the first bar of a session, a high line and a low line are created and then stretched with every new extreme. The fill between them uses the Fill Transparency setting, so the block stays readable behind the candles.
- POC - within a session the indicator watches for the bar carrying the largest volume, and places the POC line at that bar's midpoint. A heavier bar later in the session moves the line. Note this is the heaviest single bar, not a full volume-profile calculation.
- Total volume - every bar's volume inside the window is added up and shown as "Vol" for that session.
- Net delta - each bar contributes plus its volume when it closes above its open and minus its volume when it closes below. The running total is shown as "D", green when positive and red when negative. This is directional participation estimated from candle direction, not exchange bid/ask data.
- Carried levels - when the window ends, the session high, the mid (the average of high and low) and the low are drawn as separate lines and extended to the right, controlled by the Extend Max/Min | Mid switch.
- Dashboard - one row per session showing the name, a live clock with a countdown to the session opening or closing, and the POC, Vol and D values. Position and text size are adjustable.
When to act (and when not to)
Session Lite does not print entries. There is no arrow, no BUY or SELL label, no stop or target logic anywhere in the tool. What it gives you is a set of levels and a participation reading; the trade decision stays with you.
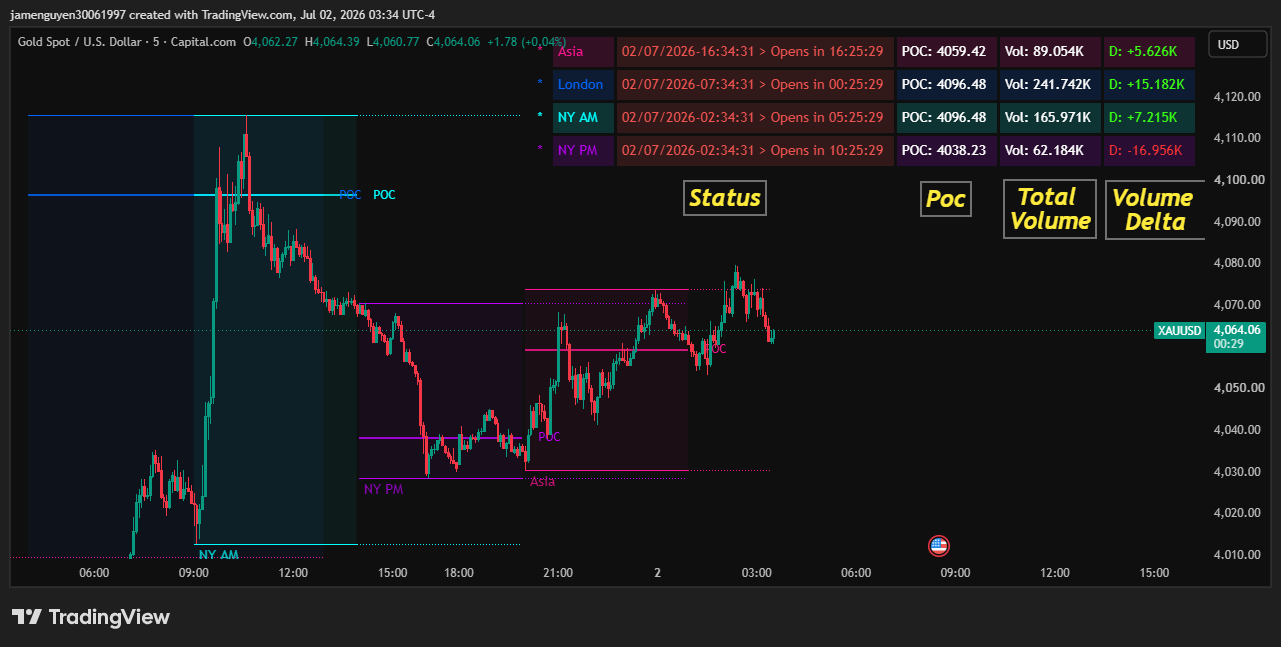
The readings the tool actually produces, and what each one means:
- A session POC - the price where the heaviest bar of that session traded. Price returning to it is returning to where that session did most of its business.
- The carried high / mid / low - the boundary the session finished with. These are the levels the next session opens against.
- Vol - how much was transacted in that session. A low figure next to a wide range is a warning that the range was cheap to create.
- D - which side of the session's volume was directional. A large positive D under a session that closed near its low, or the reverse, is a disagreement worth noticing.
Context worth reading alongside those numbers:
- a new session opening straight into the previous session's POC - the level is being tested while participation is still building;
- two consecutive sessions with POCs at almost the same price - the market has agreed on value there;
- a session with a wide range but small Vol - the boundary exists, but little was defended;
- the countdown in the dashboard approaching zero - the session about to close is the one whose levels you will be trading against next.
Weekends are excluded from the session logic, so Saturday and Sunday bars do not create session blocks.
Who benefits most from Session Lite
- Session traders - you already think in Asia / London / New York terms and want those windows drawn consistently instead of by hand.
- Intraday traders on volume-bearing markets - futures, indices and crypto. On spot FX the feed reports tick volume, so treat Vol and D as a rough proxy there.
- Traders who work from levels - you need a small set of defensible reference prices to plan around, not another signal source.
- Anyone building a routine around the open - the carried high, mid and low give the next session something concrete to react to.
A session level is a reference point, never a promise. The value is in knowing which levels had participation behind them and which did not, then working your own setups around the ones that did.
Browse the ZynAlgo marketplace
Risk note: Session Lite [ZynAlgo] is an analysis tool. It does not place trades, it does not predict what price will do next, and no indicator removes market risk. Always trade with your own plan and position sizing.
- Session Lite [ZynAlgo] v1Aug 13, 2026