Multi-Timeframe Trend Alignment Indicator for NinjaTrader 8: Reading the Panel
You see a clean long setup on the 5-minute gold chart. You take it. Three bars later it stalls and reverses, because the hourly and the daily were still pointing down the whole time and nothing on your entry chart told you that.
The obvious fix, pull up four more chart windows and eyeball each one, does not scale past a couple of symbols, and memory is not a consistent rule. By the tenth trade of the session you are reading timeframes differently than you did on the first one.
The real question is not what the trend is on the chart in front of you. It is whether the timeframes around it agree. That is a different question, and it needs a tool built to answer it directly rather than one more set of arrows on a single chart.
What a multi-timeframe trend alignment indicator for NinjaTrader 8 actually shows
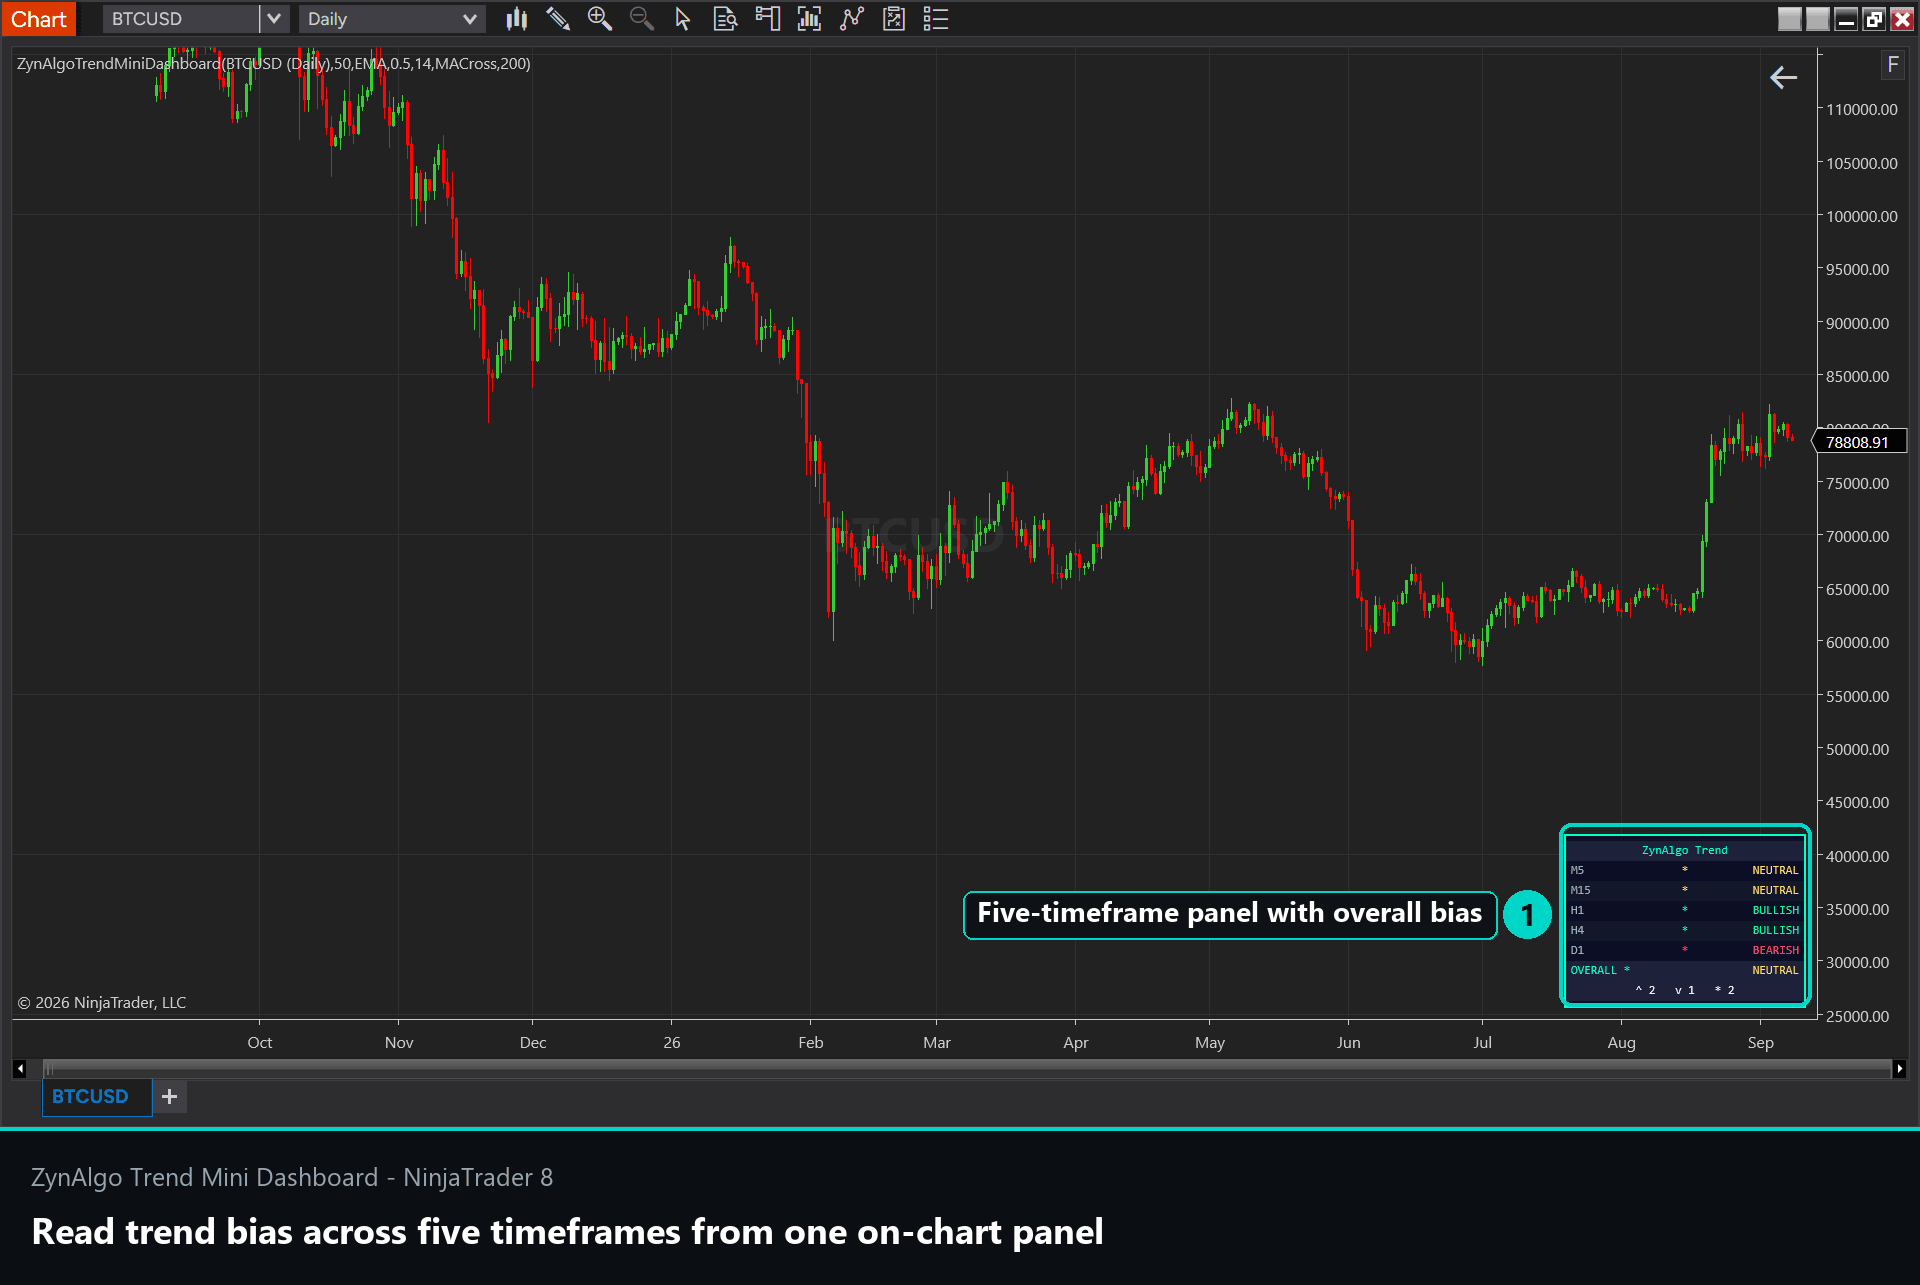
ZynAlgo Trend Mini Dashboard is a status panel for NinjaTrader 8. It does not plot BUY or SELL labels, does not set a stop-loss or take-profit, and does not manage a trade. What it does is pull up to five timeframes you choose (the defaults are M5, M15, H1, H4 and D1), run one shared classification rule across every one of them, and report the result as a small table: how many timeframes are bullish, how many are bearish, how many are neutral, and a single Overall Trend verdict.
The classification rule is one of three modes, applied identically to every enabled timeframe so the rows are directly comparable: MA Cross (a fast MA against a slow MA), Price vs MA (closing price against a slow MA), or RSI (above a bullish level, below a bearish level, otherwise neutral). A neutral buffer keeps a timeframe that is sitting on the fence from flipping back and forth every few bars.
How the panel reads in a real session
Say you are trading gold intraday and you set the panel to M5, M15, H1 and H4. Ten minutes into the New York session the row order starts to matter more than any single row.
- If all four rows read BULLISH, the environment is one-directional. A long setup on your entry chart is running with the wider picture, not against it.
- If M5 and M15 flip bullish while H1 and H4 stay bearish, that is a split reading, and it is the classic shape of a pullback inside a larger downtrend, or an early turn. Either way, it is not the same trade as full agreement, even though your 5-minute chart looks identical in both cases.
- If the Overall Trend reads NEUTRAL, the timeframes are arguing with each other. A setup taken here is a counter-current bet, not a trend trade, and the score count (say 2-to-2-to-1) tells you the margin is thin.
The panel also drives four built-in alerts (All Bullish, All Bearish, Majority Bullish, Majority Bearish), so you can be notified when the rows line up instead of watching four chart windows all session.
Trend Mini Dashboard NT8
Display the trend bias across up to five timeframes in a single panel, using one consistent classification rule to show where your chart timeframes agree.
Who this fits
- Top-down traders who already check several timeframes and want that check done the same way every time, instead of by memory.
- Intraday traders on FX, gold, indices or crypto who want to know whether the daily agrees before committing to a 5-minute entry.
- Traders who already have an entry method and need a filter, not another signal generator.
- Anyone rotating through a watchlist who wants the identical trend rule applied to every symbol, with no discretionary drift from one chart to the next.
What it does not do
Be clear-eyed about the limits before you buy this. The dashboard tells you whether timeframes agree right now. It does not tell you where to enter, where to place a stop, or when to take profit, because it has no entry logic at all. It will not warn you that a higher-timeframe candle is still forming, which means an H4 or D1 row can still shift before that bar closes. In a genuinely choppy, range-bound market, rows can flip frequently even with the neutral buffer active, because there simply isn't a clean trend on any timeframe to detect. And waiting for every row to agree before acting is its own mistake: by the time all five timeframes line up, a meaningful part of the move is often already behind you. This is a context layer, not a forecasting tool, and it does not predict what price will do next.
Trading involves risk, and nothing in this article or in the indicator itself is investment advice. Alignment describes the current environment; it is not a guarantee of direction, and you are responsible for your own entries, exits and position sizing.
Pairing it with an entry method
Because the dashboard deliberately generates no entries, it is built to sit alongside a tool that does. HalfTrend Pro NT8 holds a directional state and prints a label only when structure genuinely breaks, which pairs naturally with an Overall Trend reading: you can treat the label with more weight when the higher timeframes already agree with its direction. Dynamic Trail Breakout Pro NT8 marks pullback-and-reclaim setups inside an established trend, and knowing from the dashboard whether that trend is confirmed across timeframes, rather than just on the chart you're staring at, is exactly the kind of context it is meant to supply.
If you already run an entry system and keep catching yourself sized into a move the higher timeframes never confirmed, Trend Mini Dashboard for NinjaTrader 8 is worth a look.
Trend Mini Dashboard NT8
Display the trend bias across up to five timeframes in a single panel, using one consistent classification rule to show where your chart timeframes agree.