Why Oversold RSI Signals Fail in a Downtrend on NinjaTrader 8
You catch an oversold RSI reading on gold, take the long side, and ten minutes later price makes a new low and stops you out while the downtrend keeps rolling. This is one of the most common traps in reversal trading, and it explains why oversold RSI signals fail in a downtrend so often: the reading only tells you momentum has slowed, not that the trend itself has stopped.
Why oversold RSI signals fail in a downtrend
RSI does what it is built to do: it measures how fast price has moved, not how far a trend still has left to run. In a strong downtrend, RSI can sit under 30 for bar after bar while price keeps printing new lows. Reading that as "oversold, must bounce" treats a strong trend and a stalled range as the same condition, when they are not.
Trendline v5.0, an indicator for NinjaTrader 8, addresses this by checking whether the market is actually flat before it acts on an RSI turn at all. Its Sentiment Range MA is a stepped moving average that only re-centers once price pushes outside an ATR-sized band, so its slope reads cleanly as rising, falling, or flat. In the indicator's default mode, called Mode 4, no reversal signal is printed while that slope is rising or falling. It only starts watching RSI for a turn once the market has actually gone sideways.
What Trendline v5.0 does
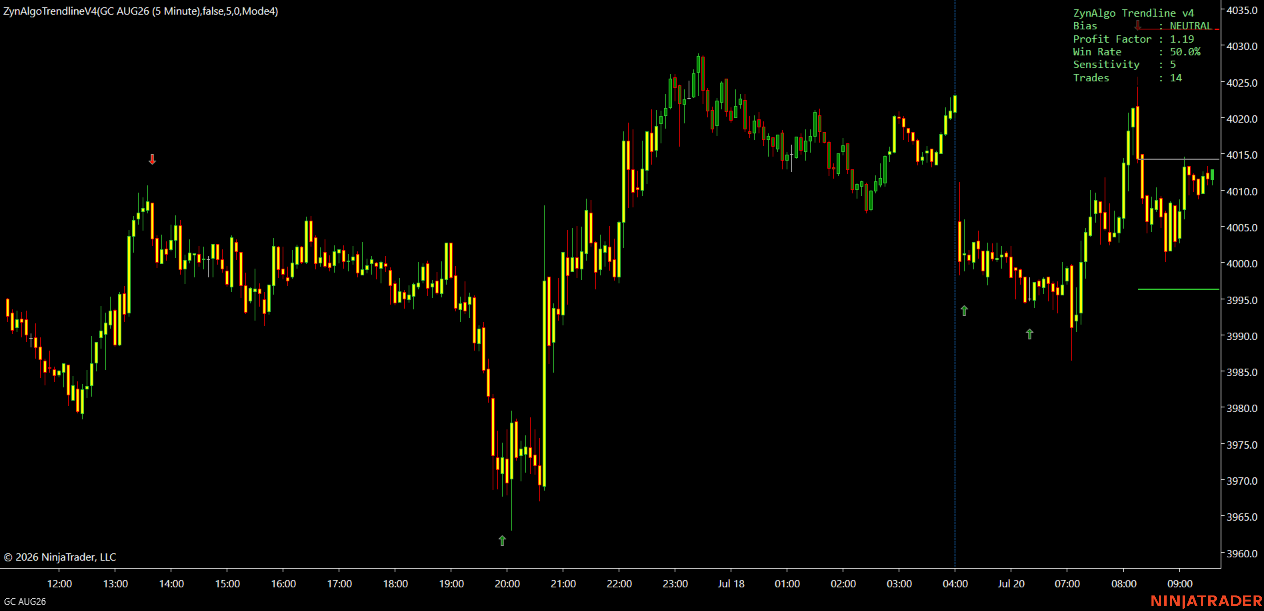
In Mode 4, a BUY prints only when the prior bar's RSI closed below 32, that reading was lower than two bars earlier, the current RSI has turned back up, price sits in the bottom 30 percent of the last 50 bars' range, and the Sentiment Range MA is flat. A SELL is the mirror condition at the top of the range. A built in cooldown of at least 10 bars keeps signals from clustering.
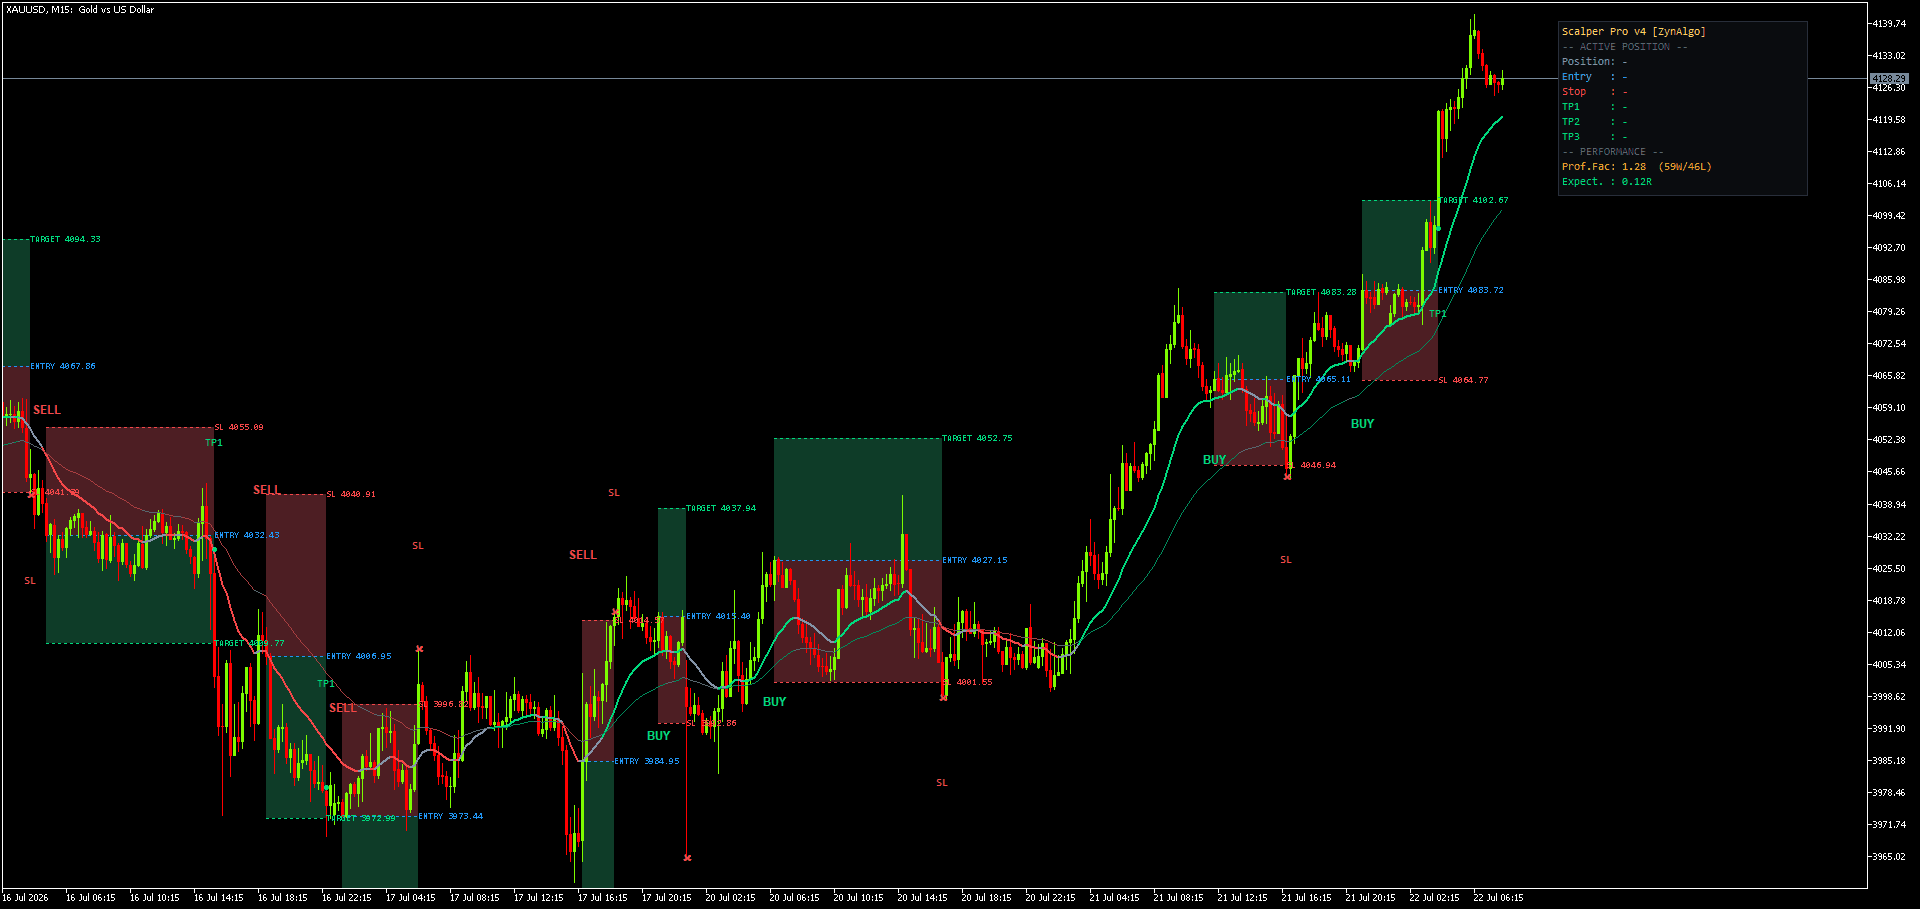
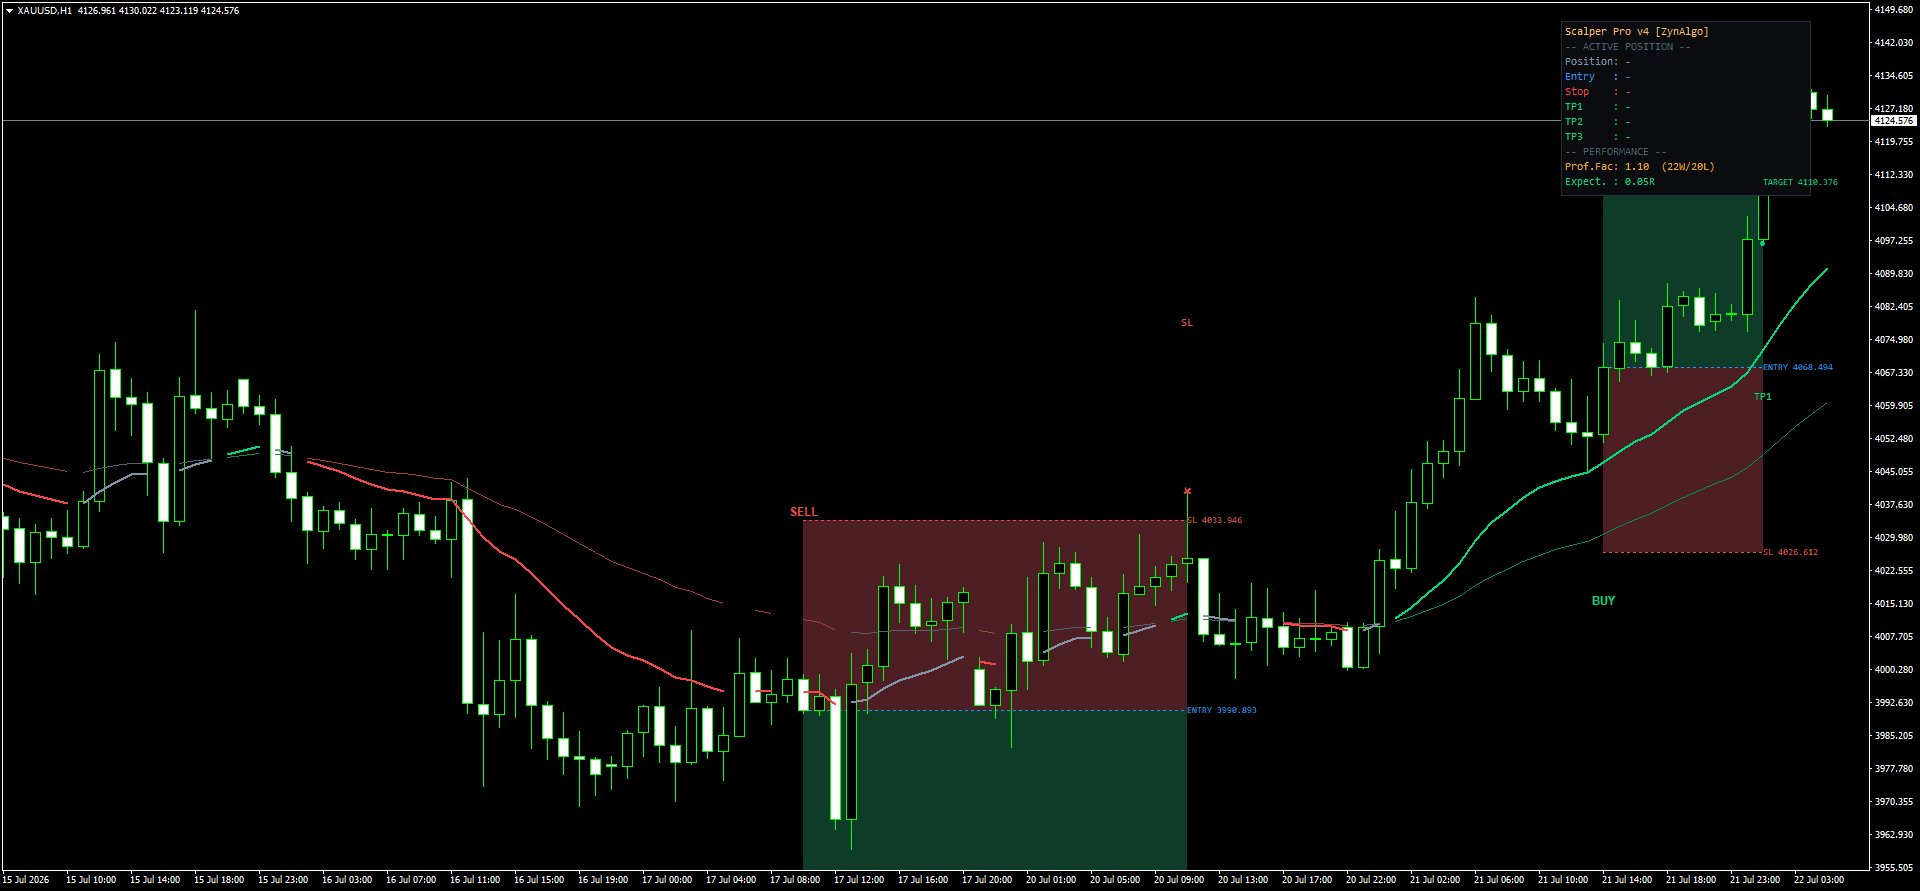
Every printed signal draws an entry, a stop set at 2.8x ATR(14), and up to three take profit levels at 1R, 2R and 3R (only TP1 is enabled by default). Each line turns dashed once its level is touched, so a glance shows what has already happened on that trade plan. A dashboard in the corner reports bias, profit factor, win rate, and trade count, calculated only over a recent lookback window, so the numbers describe recent behavior rather than the whole chart's history.
Three additional engines, Mode 1 through Mode 3, are included for traders who prefer to trade with a trend rather than wait for it to stall, using stacked EMAs or an RSI crossover. Mode 4 is the one this article focuses on, since it is the mode built specifically around the range reversal question above.
Trendline v5.0 NT8
Draw Entry, Stop Loss and three Take Profit levels on your chart for each range-reversal setup, with a live dashboard tracking Bias, Win Rate and Profit Factor on NinjaTrader 8.

Using it in a real session
Picture gold on a 15 minute chart during a multi day pullback. Candles have been colored for a falling Sentiment Range MA for several hours, so Mode 4 stays silent even as RSI dips under 30 twice along the way down. Then price stalls: a few sessions of overlapping candles, and the average steps sideways. RSI drops under 32, turns up a bar later while price sits in the bottom third of the last 50 bars, and Mode 4 prints its first BUY of the day. The entry, stop, and TP1 lines appear at the close of that bar, and the dashboard's trade count ticks up by one.
That gap between signals is deliberate. The tool is not built to comment on every RSI dip, only the ones that occur once a trend has already stopped moving.
Who it fits
Trendline v5.0 suits traders who:
- Look for range and reversal setups rather than chasing every breakout
- Work on intraday to swing timeframes, roughly M15 through H4
- Trade instruments that spend real time going sideways, such as FX majors, gold, index CFDs, or large cap crypto
- Want a stop and target already defined on the chart instead of deciding levels in the moment
If you want to be in every trending move as it happens, the default mode will feel too quiet. Mode 1 or Mode 2, both included in the same indicator, are built for that instead.
What it does not do
Trendline v5.0 does not predict where price goes next, and it does not tell you whether a flat stretch will resolve up or down before RSI actually turns. By design it will not generate Mode 4 signals during a clear trend, so on an instrument that rarely ranges you will see very few arrows. The dashboard's win rate and profit factor are calculated only over the recent Calculate Bars lookback, so they describe past behavior on that instrument and timeframe, not a forecast for future trades. It also does not manage a live position: the SL and TP lines are a plan drawn on the chart, not an order sent to your broker unless you place it yourself.
Trading involves risk, and nothing in this indicator or in this article is investment advice. Past behavior on a chart does not predict future results, and you remain responsible for your own entries, sizing, and exits.
How it pairs with other tools
If you want more context around a Mode 4 signal before you act on it, Liquidity Heatmap NT8 maps where order concentration has built up on the chart, and MTF Command Center NT8 lets you check a higher timeframe without switching charts. Neither changes what Trendline v5.0 signals; they simply give you more of the picture to look at while you decide whether to act on one.
Trendline v5.0 NT8
Draw Entry, Stop Loss and three Take Profit levels on your chart for each range-reversal setup, with a live dashboard tracking Bias, Win Rate and Profit Factor on NinjaTrader 8.