How to Use Take Profit and Stop Loss on TradingView (and Indicators That Draw Them)
Quick answer: on TradingView you can set a take profit and stop loss in two ways: draw them with the Long Position or Short Position tool to plan the trade, or attach them to an order in the trading panel when you place it. A TradingView indicator with entry, stop loss and take profit goes one step further: the moment its signal confirms, it draws the entry price, a stop sized to current volatility and one or more targets at fixed reward-to-risk multiples, so every signal arrives as a complete plan.
Most traders who lose money on a good setup lose it after the entry. The stop goes where it "feels right", the target moves while the trade is open, and a winner is closed early because there was never a plan for it. This guide explains how stop loss and take profit work on TradingView, how to size them properly, the mistakes that cost the most, and what to look for in an indicator that draws the whole plan for you.
How to use take profit and stop loss on TradingView
TradingView gives you two separate tools, and they do different jobs.
1. Planning: the Long Position and Short Position tools
In the left drawing toolbar, under the forecasting and measurement tools, you will find Long Position and Short Position. Click on the chart at your entry price and the tool draws a green profit zone and a red risk zone. Drag the top and bottom edges to your target and stop. The tool shows the distance in price and percent, the risk-to-reward ratio, and, if you enter an account size and risk amount in its settings, a suggested position size.
This is a planning drawing only. It does not place or manage an order. Its value is that it forces you to define both exits before you enter, and it stays on the chart so you can review the trade afterwards.
2. Execution: stop loss and take profit on the order
If you trade through a broker connected to TradingView, or through Paper Trading, the order ticket has Take Profit and Stop Loss options. Tick them and enter the price (or the distance) for each, and they are sent with the entry as a bracket. Once the position is open, the stop and target appear as lines on the chart that you can drag to adjust. Exact behaviour depends on the broker, so check how your broker handles modified or partially filled brackets.
The planning tool answers "where should my exits be?" The order ticket answers "make sure they are actually there." Use both.
How to decide where the stop and target go
Think in R, not in pips or dollars
R is the distance from entry to stop, your unit of risk. A target at 2R is twice that distance away. Thinking in R lets you compare trades across instruments: a 2R winner on gold and a 2R winner on EURUSD are the same result relative to what you risked, even though the price distances are very different.
Size the stop to volatility
A fixed 20-pip stop is too tight on gold during the New York open and too wide on EURUSD in a quiet Asian session. A stop based on ATR (Average True Range, the average size of recent bars) widens and narrows with the market. A common approach is a multiple of ATR(14): far enough that normal noise does not touch it, close enough that the trade is clearly wrong if it does.
Place targets at fixed multiples, then decide how to manage them
Staged targets at 1R, 2R and 3R let you take part of the position early and give the rest room. A common management rule is to move the stop on the remaining position to the entry price (breakeven) once the first target is reached. Whatever rule you choose, decide it before the entry and write it down.
Then set position size from the stop, not the other way round
Decide how much of the account you are willing to lose on one trade, then divide by the stop distance to get the size. If the volatility-based stop is wide, the position gets smaller. Shrinking the stop to fit a size you wanted is how most stops end up inside normal noise.
Trendline v5.0 TDV
Identify range reversals when RSI turns at the edge of the 50-bar range, then draw your complete trade plan with entry, stop loss, and targets as reward and risk boxes.

Common mistakes with stop loss and take profit
- Stops at obvious round numbers or exactly at a swing low. Many traders place them in the same spot, and price often trades a little beyond it. Give the stop a volatility buffer.
- Moving the stop further away during the trade. This turns a 1R loss into a 2R or 3R loss. The stop should only ever move in your favour.
- A target with no reason behind it. If the target is not a fixed R multiple or a clear level, it tends to move with your emotions.
- Planning on the chart but not on the order. A drawn stop does nothing if the order has no stop attached and the platform or connection fails.
- Judging the method on a handful of trades. Any stop and target rule needs a long run of trades to show how it behaves. Reviewing history on the chart is the fastest way to see that.
Worked example: planning one trade by hand
Say you are on a one-hour EURUSD chart and your setup triggers a buy at 1.0850 on a closed candle. ATR(14) reads 0.0012. You use a stop of 2.8 times ATR, which is 0.00336, so the stop sits at about 1.0816. That distance is 1R.
Your targets are 1R at about 1.0884, 2R at about 1.0917 and 3R at about 1.0951. You decide in advance: take part of the position at 1R, move the stop on the rest to 1.0850, and let it run to 2R or 3R. You draw this with the Long Position tool, then place the order with the stop and the first target attached.
Two days later you can see exactly what happened: whether the stop was hit first, whether 1R was reached and the trade went back to breakeven, or whether it ran to 3R. Doing this by hand on every signal is slow, which is why many traders prefer an indicator that draws it automatically.
What a TradingView indicator with entry, stop loss and take profit should show
- A fixed entry reference at the close of the confirmed signal candle, so you can compare your real fill with the plan.
- A volatility-based stop, usually a multiple of ATR, drawn at the moment of the signal.
- One to three targets at fixed R multiples, visible before you enter, not added afterwards.
- Breakeven handling once the first target is reached, if you use more than one target.
- The result on the chart once the trade closes, so you can scroll back and review weeks of signals in minutes.
- Alerts that carry the levels, so an alert gives you symbol, entry, stop and targets instead of only "buy".
How Trendline v5.0 draws the full trade plan
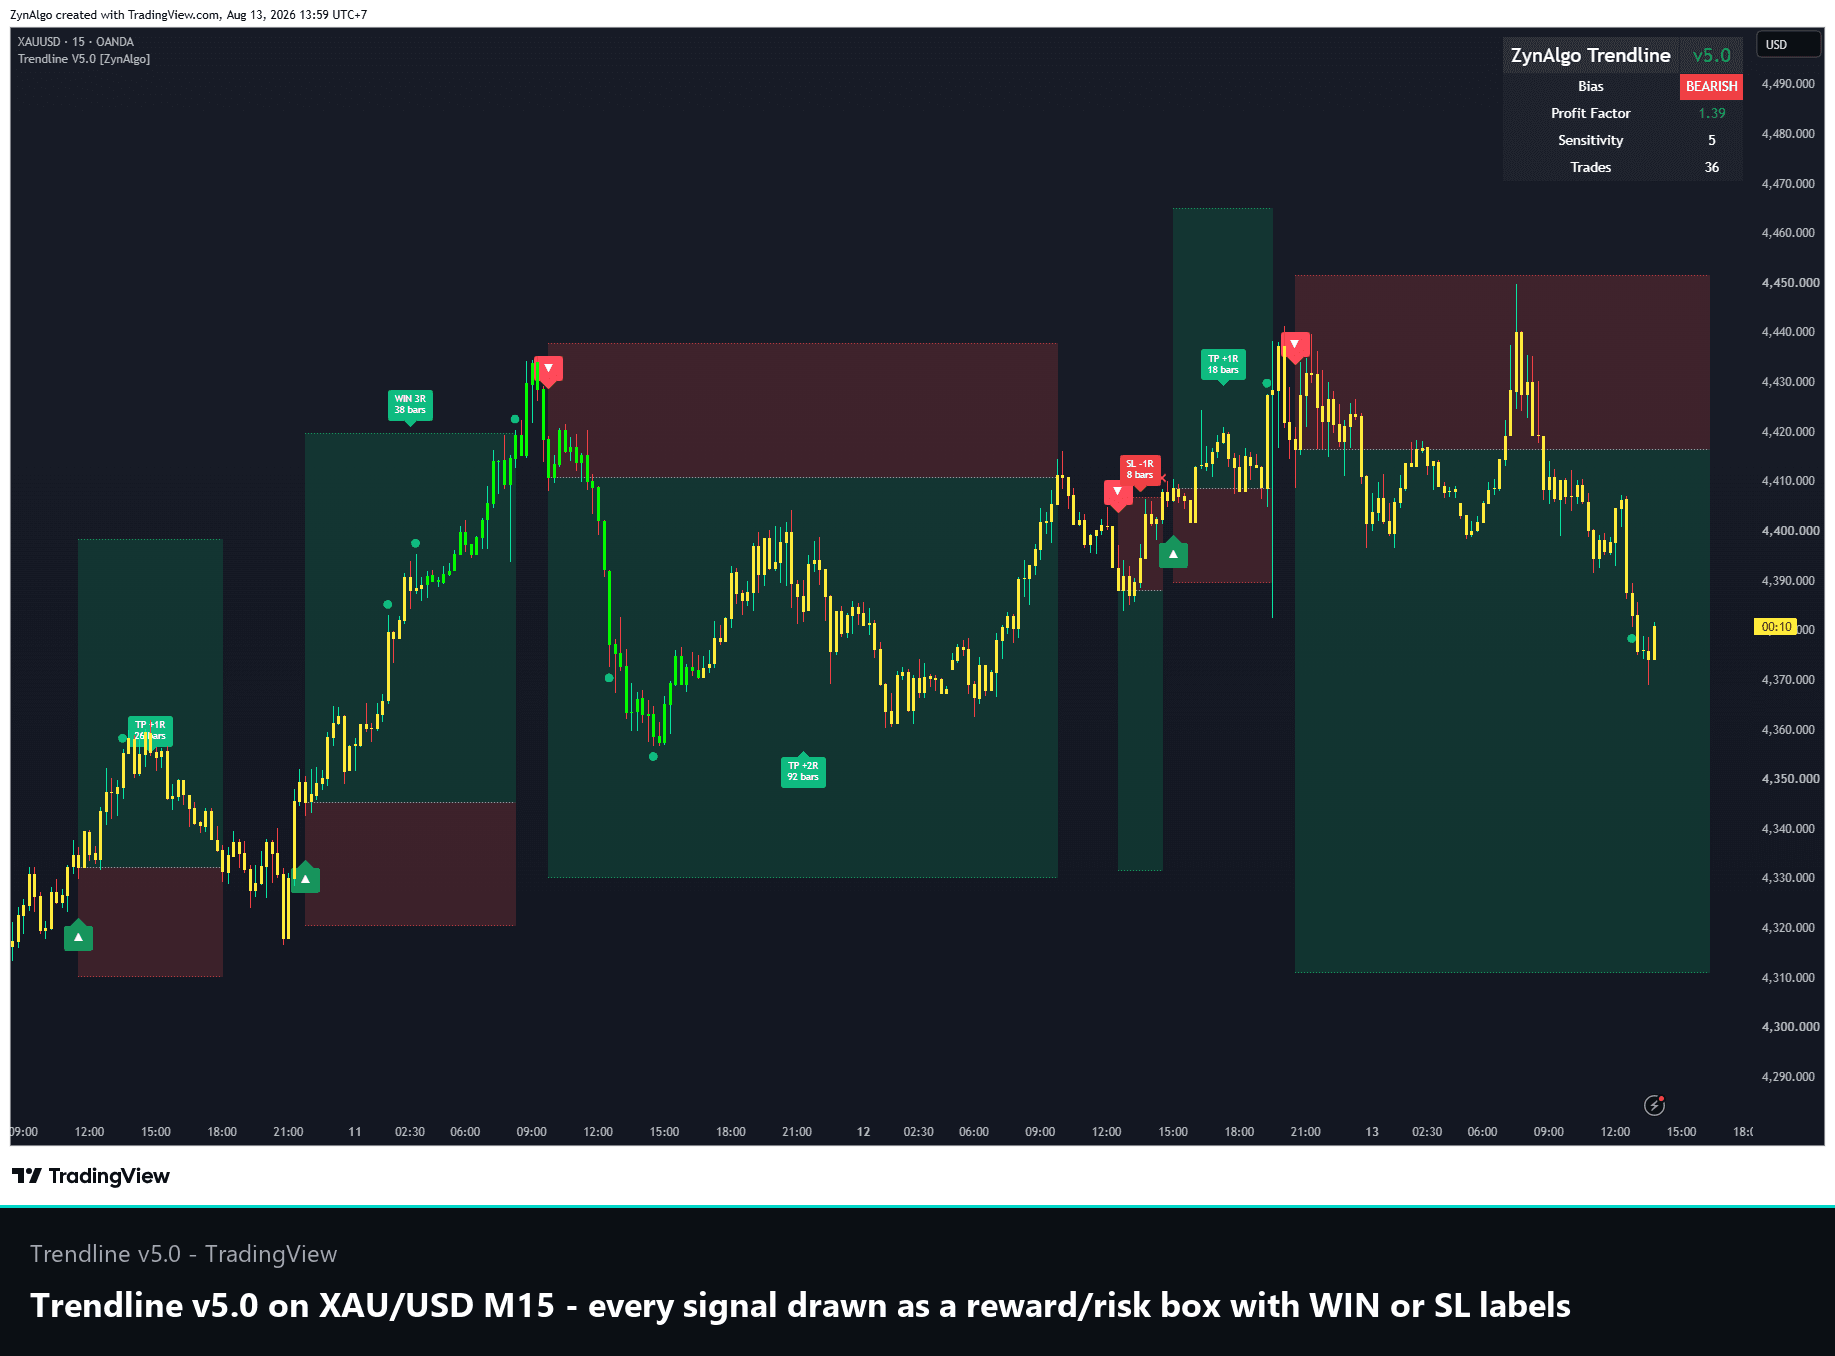
Trendline v5.0 is a TradingView indicator built around this idea. Every printed signal is drawn as a trade panel:
- Entry is the close of the signal bar, marked with a dotted line and a green triangle (buy) or red triangle (sell).
- Stop loss sits ATR(14) multiplied by the Distance setting (2.8 by default) away from the entry, shown as a red risk box.
- Take profit: TP1 at 1R is on by default; TP2 at 2R and TP3 at 3R can be switched on. The green reward box runs from the entry to the active target.
- Breakeven: with TP2 or TP3 enabled, the stop moves to breakeven once TP1 is reached. Small green dots mark each interim target hit along the way.
- Result labels: when the trade closes the box is stamped with what it recorded, such as WIN xR, SL -1R, BE 0R, TP +xR, or TIME for a trade closed by the maximum duration (200 bars by default), along with how many bars it took. A compact dashboard summarises the history on your chart.
- Alerts: structured JSON alerts on bar close with symbol, entry, stop and targets, plus ready-made TradingView alert conditions.
Where the signals come from
The default engine (Mode 4) first classifies the market with its Balance Regime Engine as Rising, Falling or Balanced, and colours the candles green, red or yellow to match. It only looks for entries while the market is Balanced: a buy needs RSI to turn back up from below 32 while price sits in the bottom 30% of the last 50 bars' range, and a sell is the mirror image near the top. Three alternative modes (an RSI momentum turn as price leaves a balanced phase, a pullback onto stacked EMAs, and the bar where three EMAs first stack) suit traders who prefer to trade with the trend.
Signals then pass shared filters: a 10-bar cooldown, Stability Mode (on by default, no new signal while a trade is open), and optional Smart Signal, Session and Follow Trend filters. The full rules are in the manual on the product page.
Who it suits
Intraday and swing traders on M15 to H4 who trade FX majors, gold, index CFDs or large-cap crypto, prefer range-reversal entries, and want a defined stop and target on every signal instead of deciding levels in the moment. If you would like to see ATR stops and multi-R targets on a simpler pullback tool first, 3-Way Bollinger Trend draws them too and is listed among the free indicators.
Frequently asked questions
How do I set a stop loss and take profit on TradingView?
To plan, use the Long Position or Short Position tool from the drawing toolbar and drag its edges to your stop and target. To execute, tick Take Profit and Stop Loss in the order ticket of a connected broker or Paper Trading account, enter the levels, and they are sent with the entry. You can drag the lines on the chart to adjust them afterwards.
Is there a TradingView indicator that shows entry, stop loss and take profit automatically?
Yes. Some indicators draw these levels on every signal. Trendline v5.0 draws the entry, an ATR-based stop and up to three targets as reward and risk boxes when a signal prints, and labels the result when the trade closes.
What is a good stop loss distance?
There is no single number. A volatility-based stop, typically a multiple of ATR(14), adapts to each instrument and timeframe, which makes it a sensible starting point. Then size the position so that hitting the stop costs only the amount you planned to risk.
Does an indicator place the stop and target orders for me?
An indicator draws levels and can send alerts; it does not place orders by itself. You still enter the stop and target on your order, or route the alerts through an automation service you have set up.
Can I review how the stop and target rules behaved in the past?
With on-chart result labels you can scroll back through past signals on any symbol and timeframe and see which reached a target and which reached the stop. Treat that history as a view of how the rules behave, not a forecast.
Trading involves risk; indicators support decisions, they do not guarantee results.
Trendline v5.0 TDV
Identify range reversals when RSI turns at the edge of the 50-bar range, then draw your complete trade plan with entry, stop loss, and targets as reward and risk boxes.