
Price Footprint Shadow
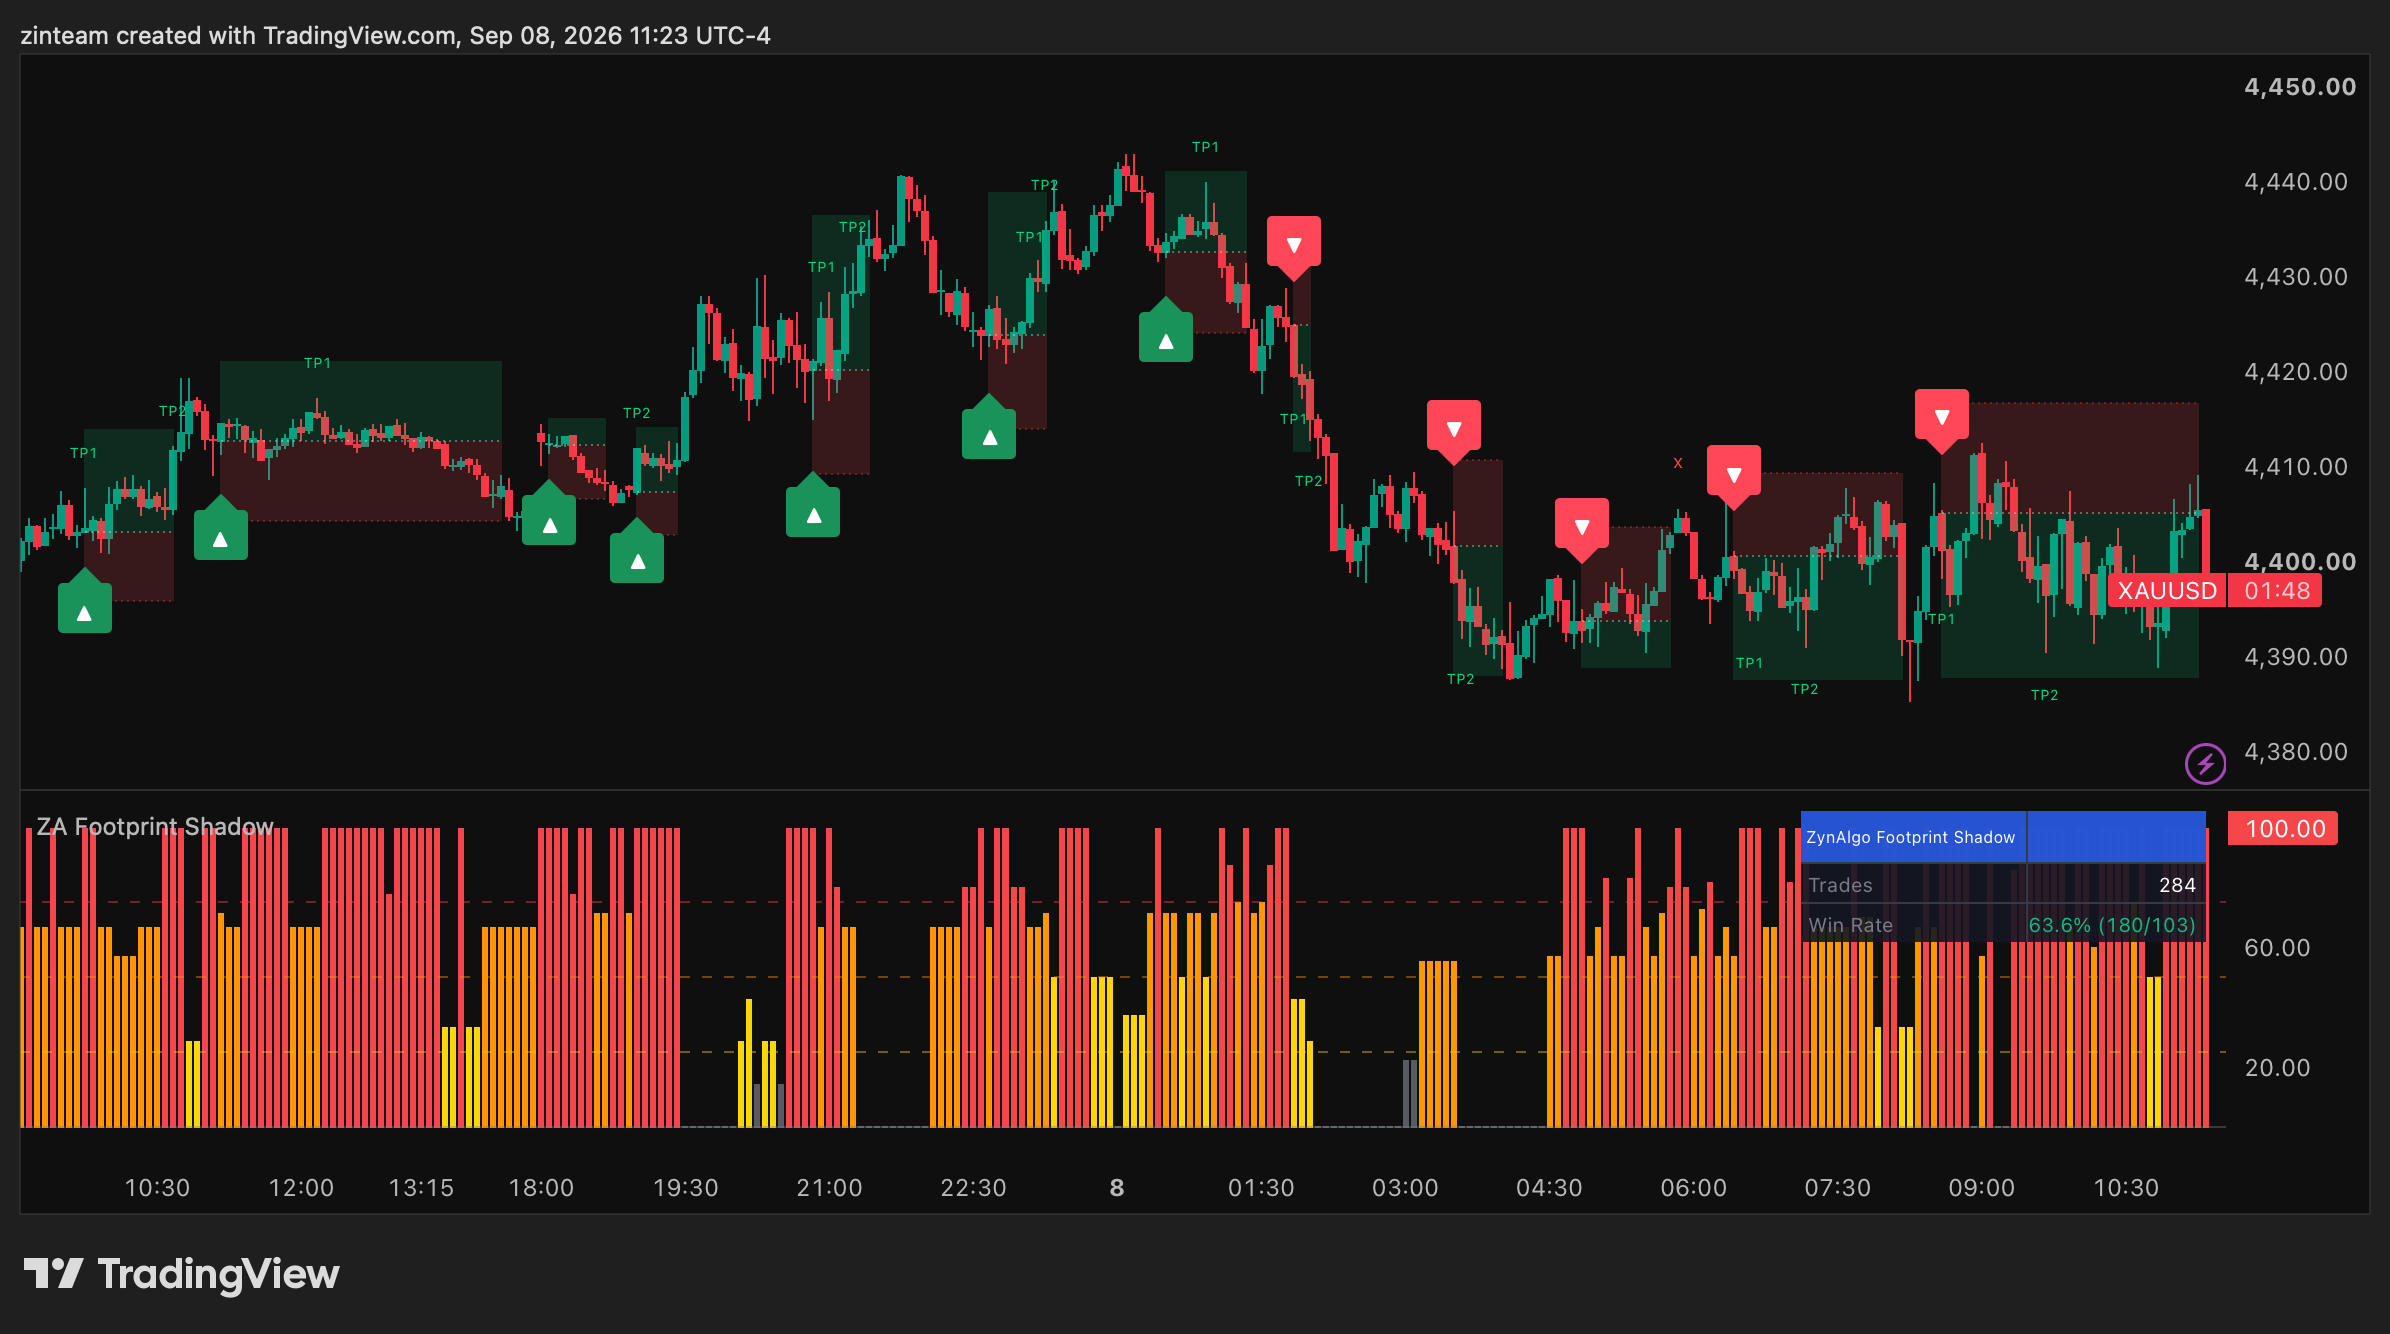
A price footprint indicator for TradingView that focuses on where past swings actually paused, not on every level a wick happens to touch. Price Footprint Shadow [ZynAlgo] rebuilds the time-at-price footprint of each completed swing, shows how much of it sits at the current price as a 0-100 Footprint Strength column, and prints ▲ / ▼ markers only when a rejection candle confirms the zone on your TradingView chart.
Key benefits
- Zones from dwell time: support and resistance come from where price genuinely lingered, so the levels are earned rather than drawn.
- Confirmation before every marker: a strong footprint is only a precondition; a wick-dominant rejection candle has to close before a signal prints.
- Quiet chart by design: a trend gate, a cooldown, a stability lock and an optional alternation filter keep markers spaced out and readable.
How it works
Each completed swing leg is split into price bins, scored by how many bars of that leg overlapped each bin. The strongest remembered score at the current close becomes Footprint Strength. When it clears your threshold and the bar closes as a rejection candle that agrees with the trend gate, a ▲ or ▼ marker and a TP/SL box are placed on the next bar's open. Hover the marker to read the reason. Full walkthrough in the Manual.
What's included / Platforms
- TradingView indicator, Pine Script v6, added to your TradingView username once access is granted. Free for all ZynAlgo members.
Best for
Reversal and pullback traders on any market who want levels backed by real time-at-price behaviour and a candle confirmation before acting.
Get started
Browse the ZynAlgo marketplace
Disclaimer: for research and education only, not financial advice. Signals are not guarantees and no indicator removes market risk - trade with your own plan and position sizing.
Price Footprint Shadow
The idea behind Price Footprint Shadow
Price Footprint Shadow [ZynAlgo] starts from a simple observation: a swing move does not spend its time evenly. Somewhere inside each leg price stalls and leaves a dense cluster of bars behind, while the rest of the leg is crossed in a hurry. Those dense pockets are the footprint of the move, and they tend to matter again when price returns. The tool rebuilds that footprint for every completed swing, keeps the most recent ones in memory, and condenses them into one reading - Footprint Strength, a 0-100 column in its own pane that says how much historical footprint sits at the current price. It then waits for a rejection candle in the direction of the zone, runs the result through an internal trend gate and frequency controls, and only then prints a ▲ or ▼ marker with a TP/SL box on your TradingView chart. The philosophy is location first, confirmation second: a strong footprint is a necessary condition, never a sufficient one.
The role of the Shadow Profile
The Shadow Profile is the memory of where a swing leg paused. Each time a move completes, the tool splits its price range into equal bins and counts how many of that move's bars overlapped each bin. A bin crossed once by a single large candle scores low; a bin price sat inside for a dozen bars scores high. The counts are normalised so the busiest bin equals 1.0. This is a time-at-price proxy built from bar ranges - not exchange volume, and the tool never pretends it is. What it captures is dwell time, which turns an arbitrary price into a level the market remembers.
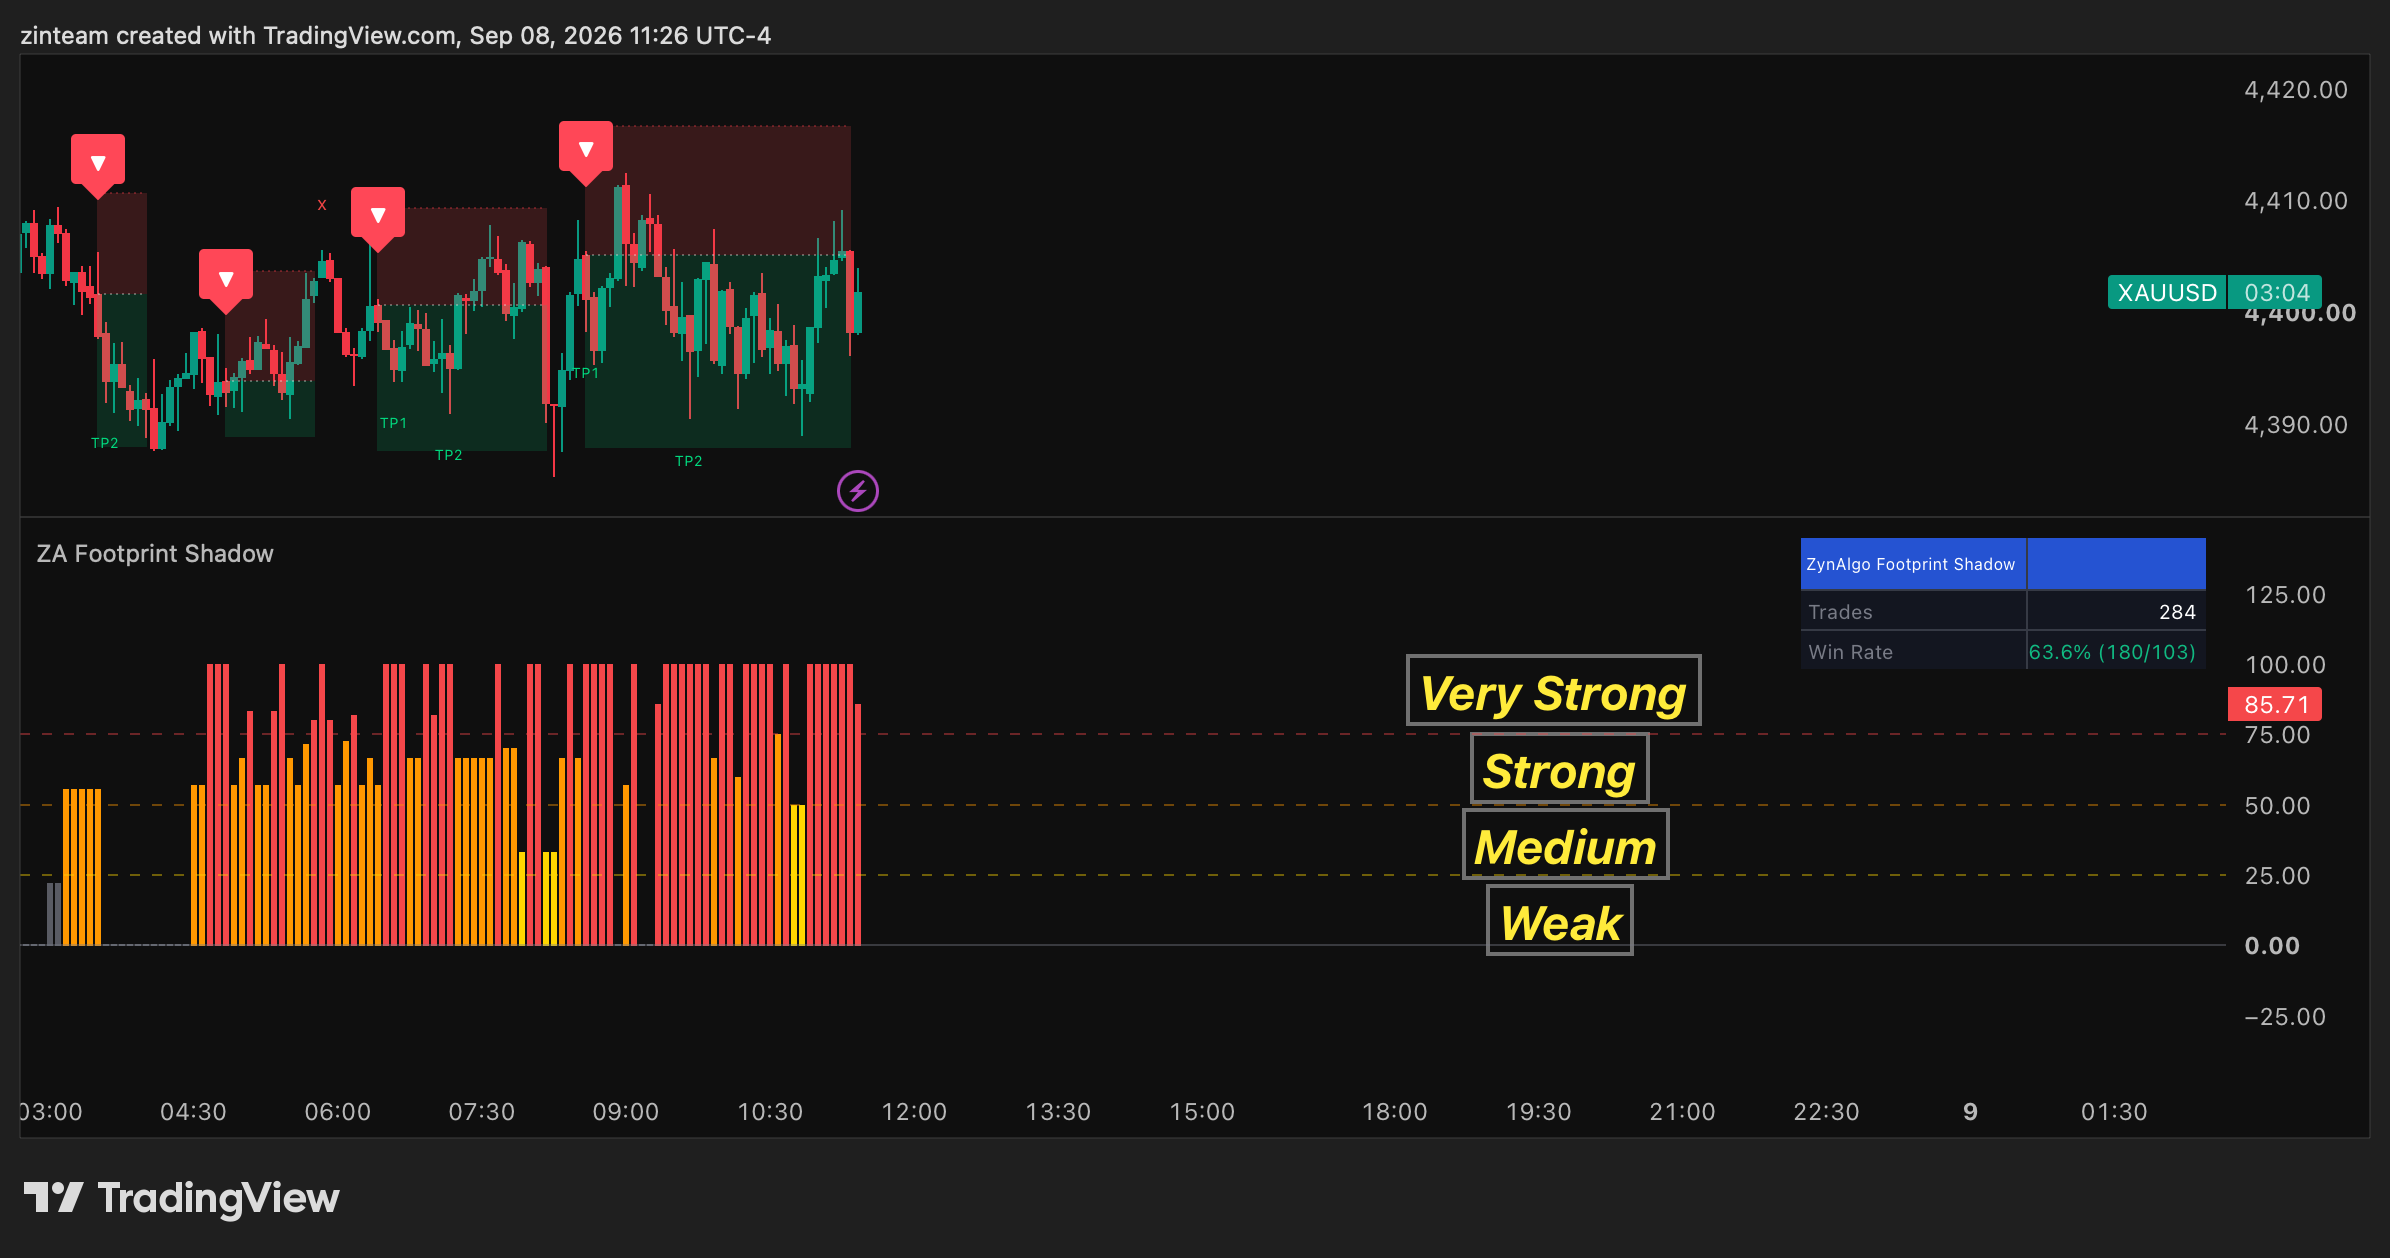
What you see in the indicator pane:
- a column histogram called Footprint Strength, running from 0 to 100;
- the column turns red above 75 (Very Strong), orange above 50 (Strong), yellow above 25 (Medium) and stays gray near 0 (Weak / No Footprint);
- dashed reference lines at 75, 50 and 25 and a solid baseline at 0, labelled with those names;
- a small gray "Cooldown: N bars" label on the last bar while the cooldown is still counting (Show Cooldown Countdown on Chart).
Common mistake: treating a tall column as a signal in itself. Footprint Strength only says that price is inside a pocket where a previous swing spent a lot of time; price can slice straight through it. A marker is allowed only when a rejection candle proves the pocket is actually holding.
How the Shadow Profile is defined
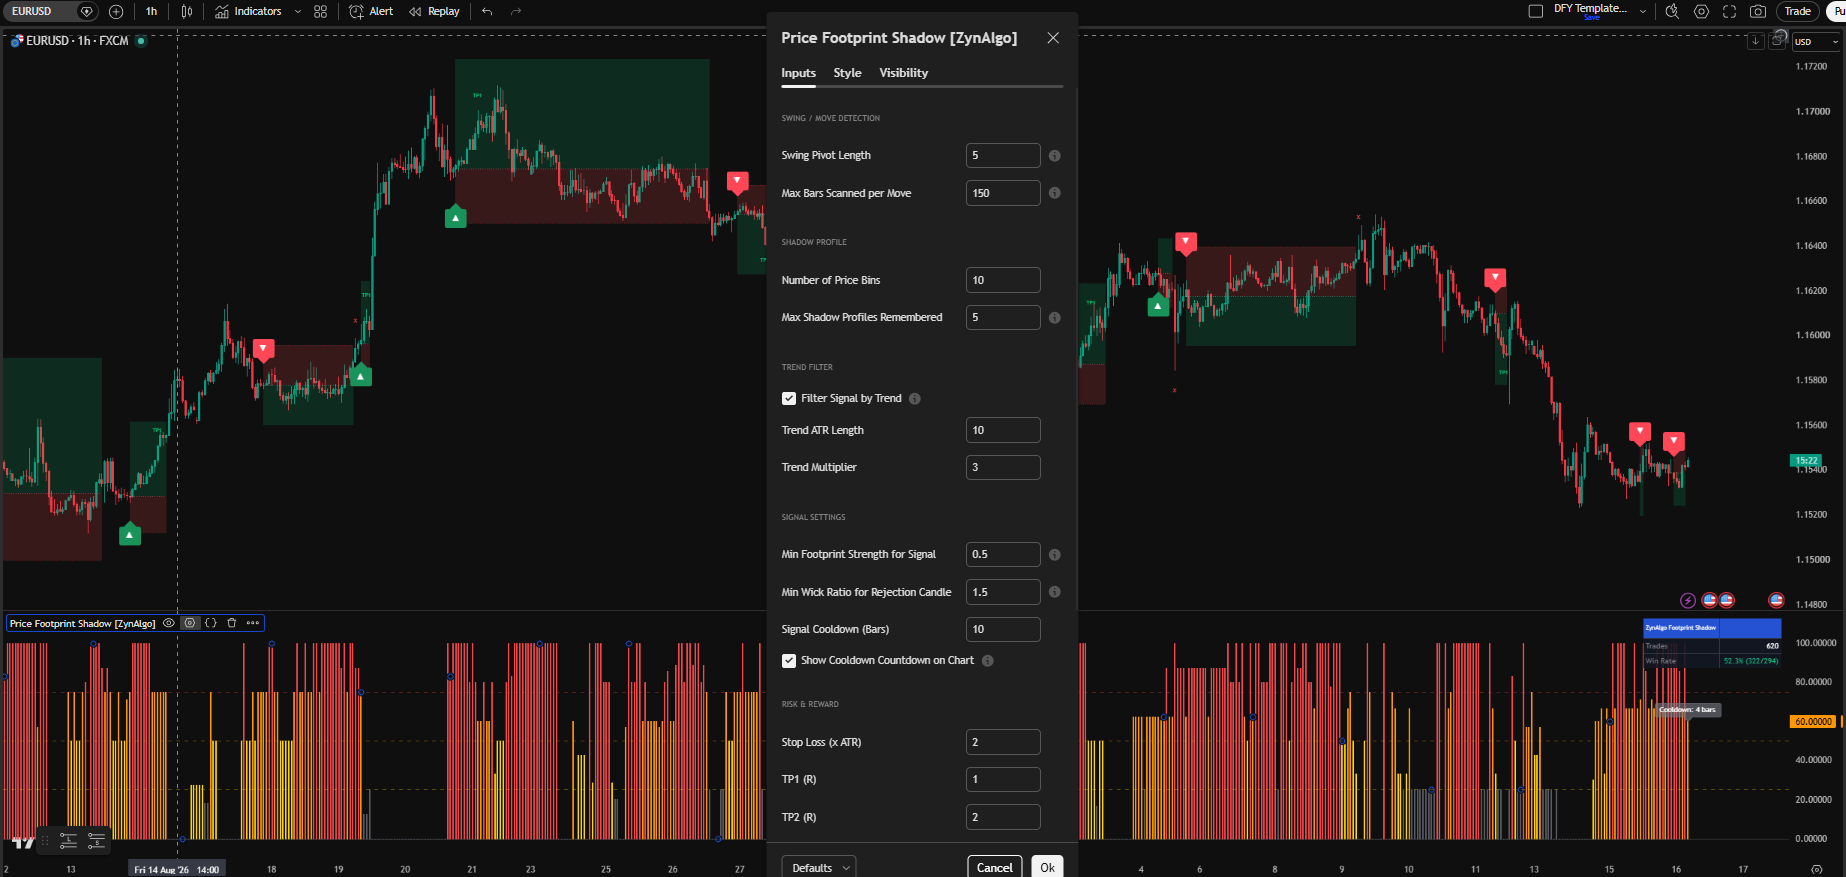
- Swing Pivot Length: bars on each side needed to confirm a swing high or low. A move is the leg between two consecutive opposite pivots - a confirmed swing low to the next confirmed swing high, or the reverse.
- Max Bars Scanned per Move: a safety cap; a very long leg only scans this many of its most recent bars.
- Number of Price Bins: how many equal slices the move's range is cut into. More bins give finer pockets; fewer give broader zones.
- Max Shadow Profiles Remembered: how many completed moves stay in memory; the oldest profile is dropped once this limit is exceeded.
- Footprint Strength: the highest ratio among all remembered bins that contain the current close, scaled to 0-100. Outside every remembered pocket the reading is 0.
Reading the signals
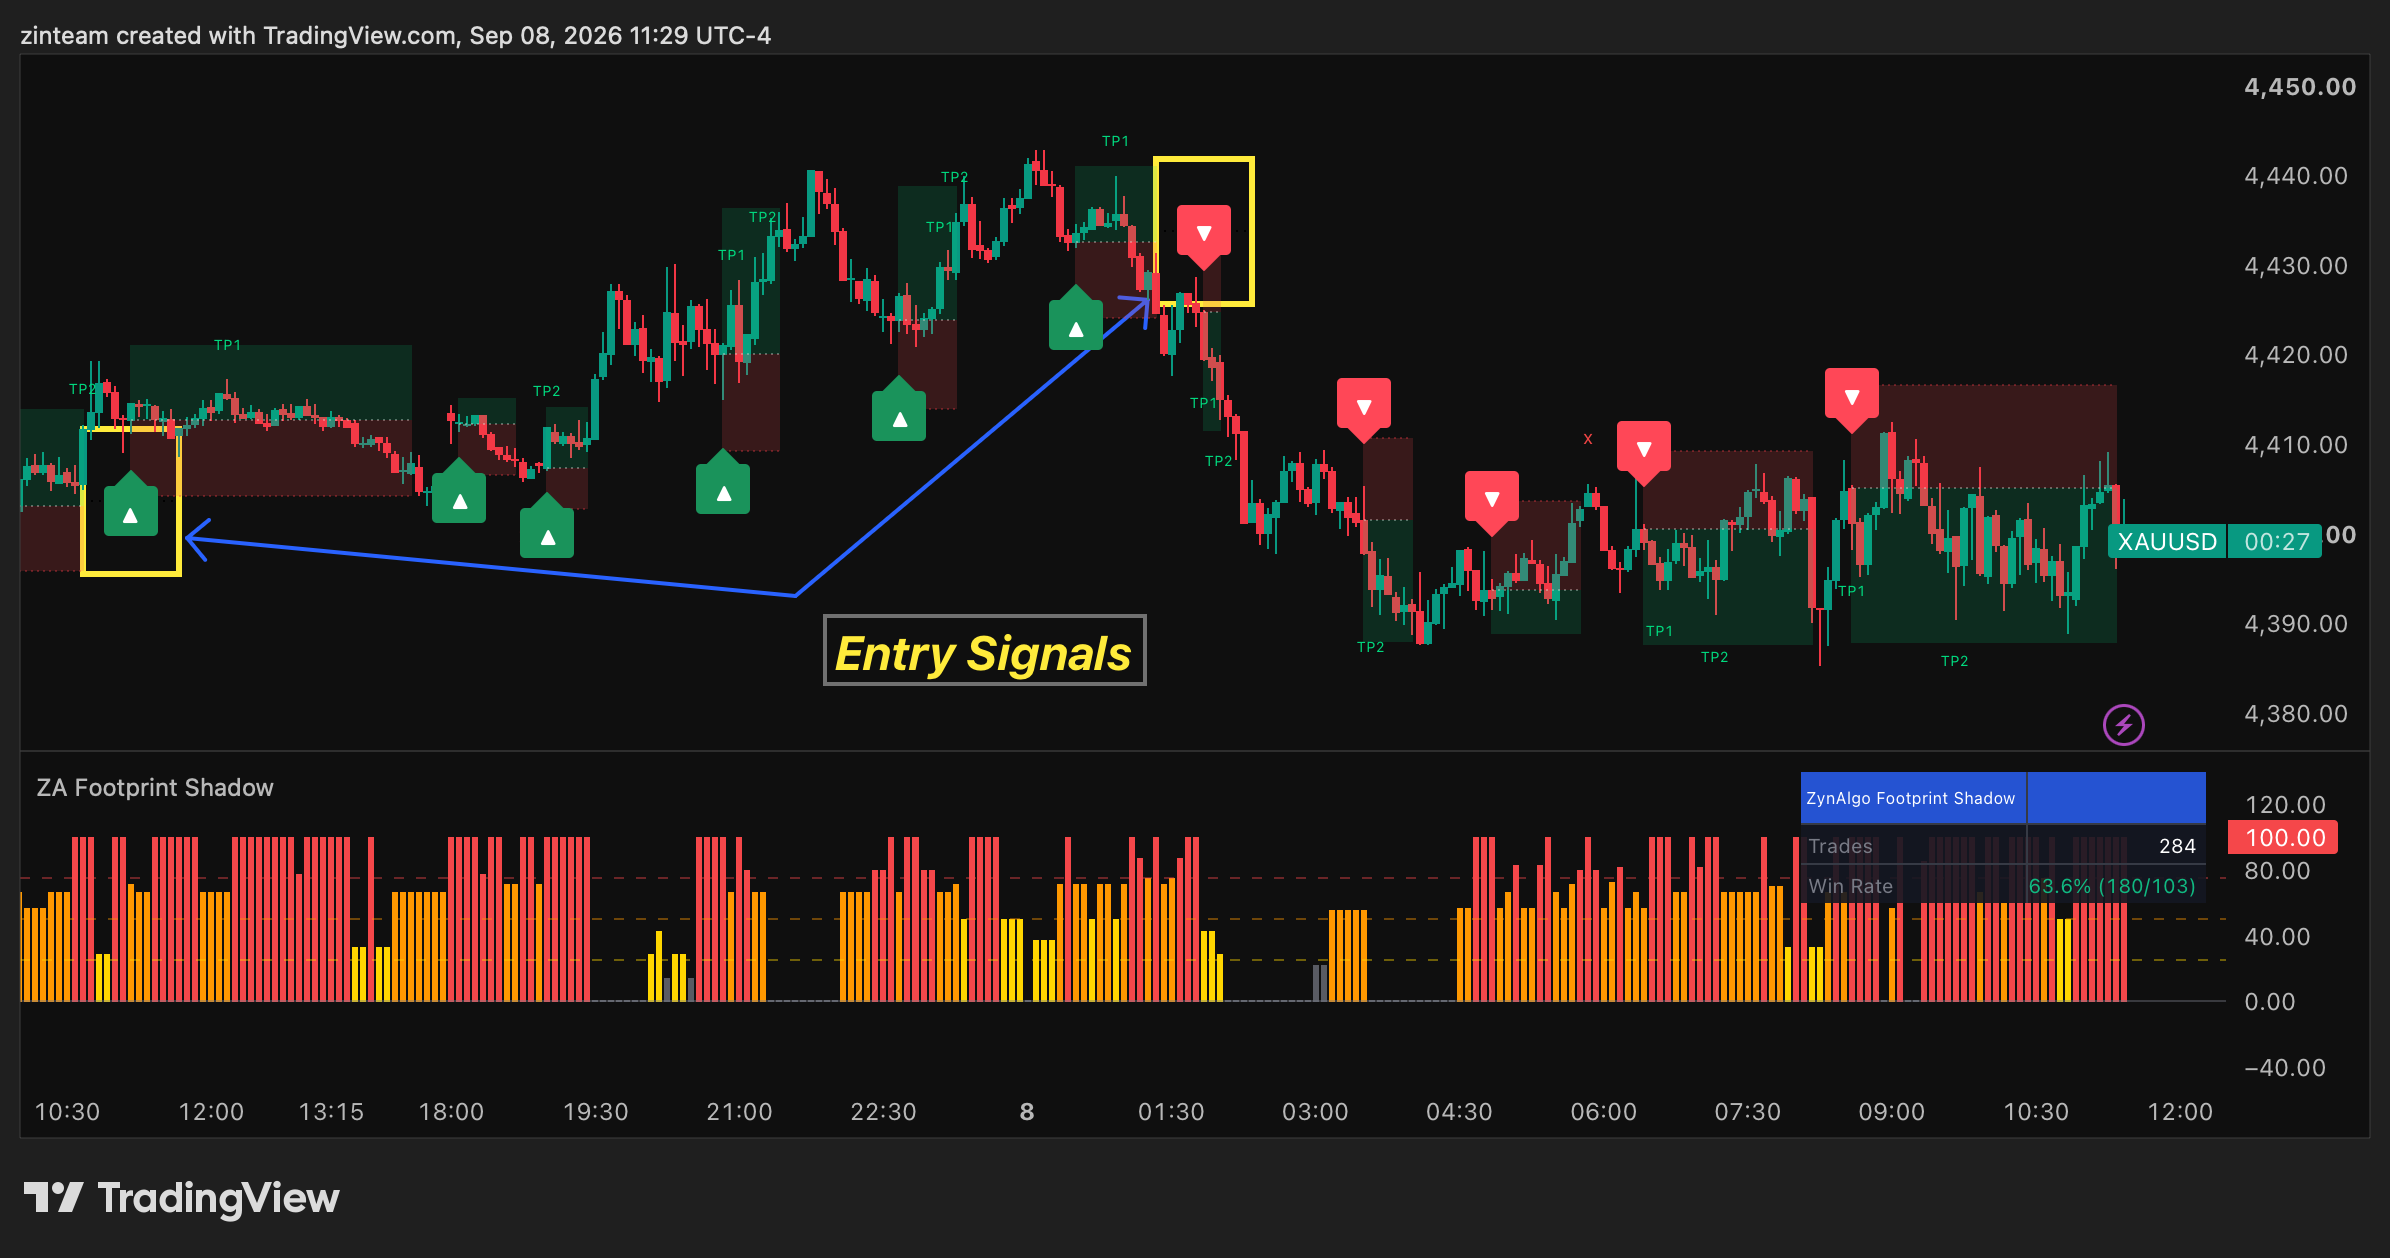
A ▲ marker (green, below the bar) is queued on the close of a bar when all of these are true:
- Footprint Strength is above Min Footprint Strength for Signal (0.5 by default, so the column must be at least Strong);
- the bar is a bullish rejection candle: its lower wick exceeds the upper wick times Min Wick Ratio for Rejection Candle, and exceeds the candle body;
- the trend gate agrees - an internal Supertrend built from Trend ATR Length and Trend Multiplier is bullish, or Filter Signal by Trend is off (the trend line is never drawn);
- Stability Mode is off, or no simulated position is open;
- Smart Signal Filter is off, or the previous signal was not also a BUY;
- at least Signal Cooldown (Bars) bars have passed since the last signal.
The marker is placed on the following bar at its open, which is also the entry price of the TP/SL box. Hover the marker to read the reason: it shows "Footprint zone (support)".
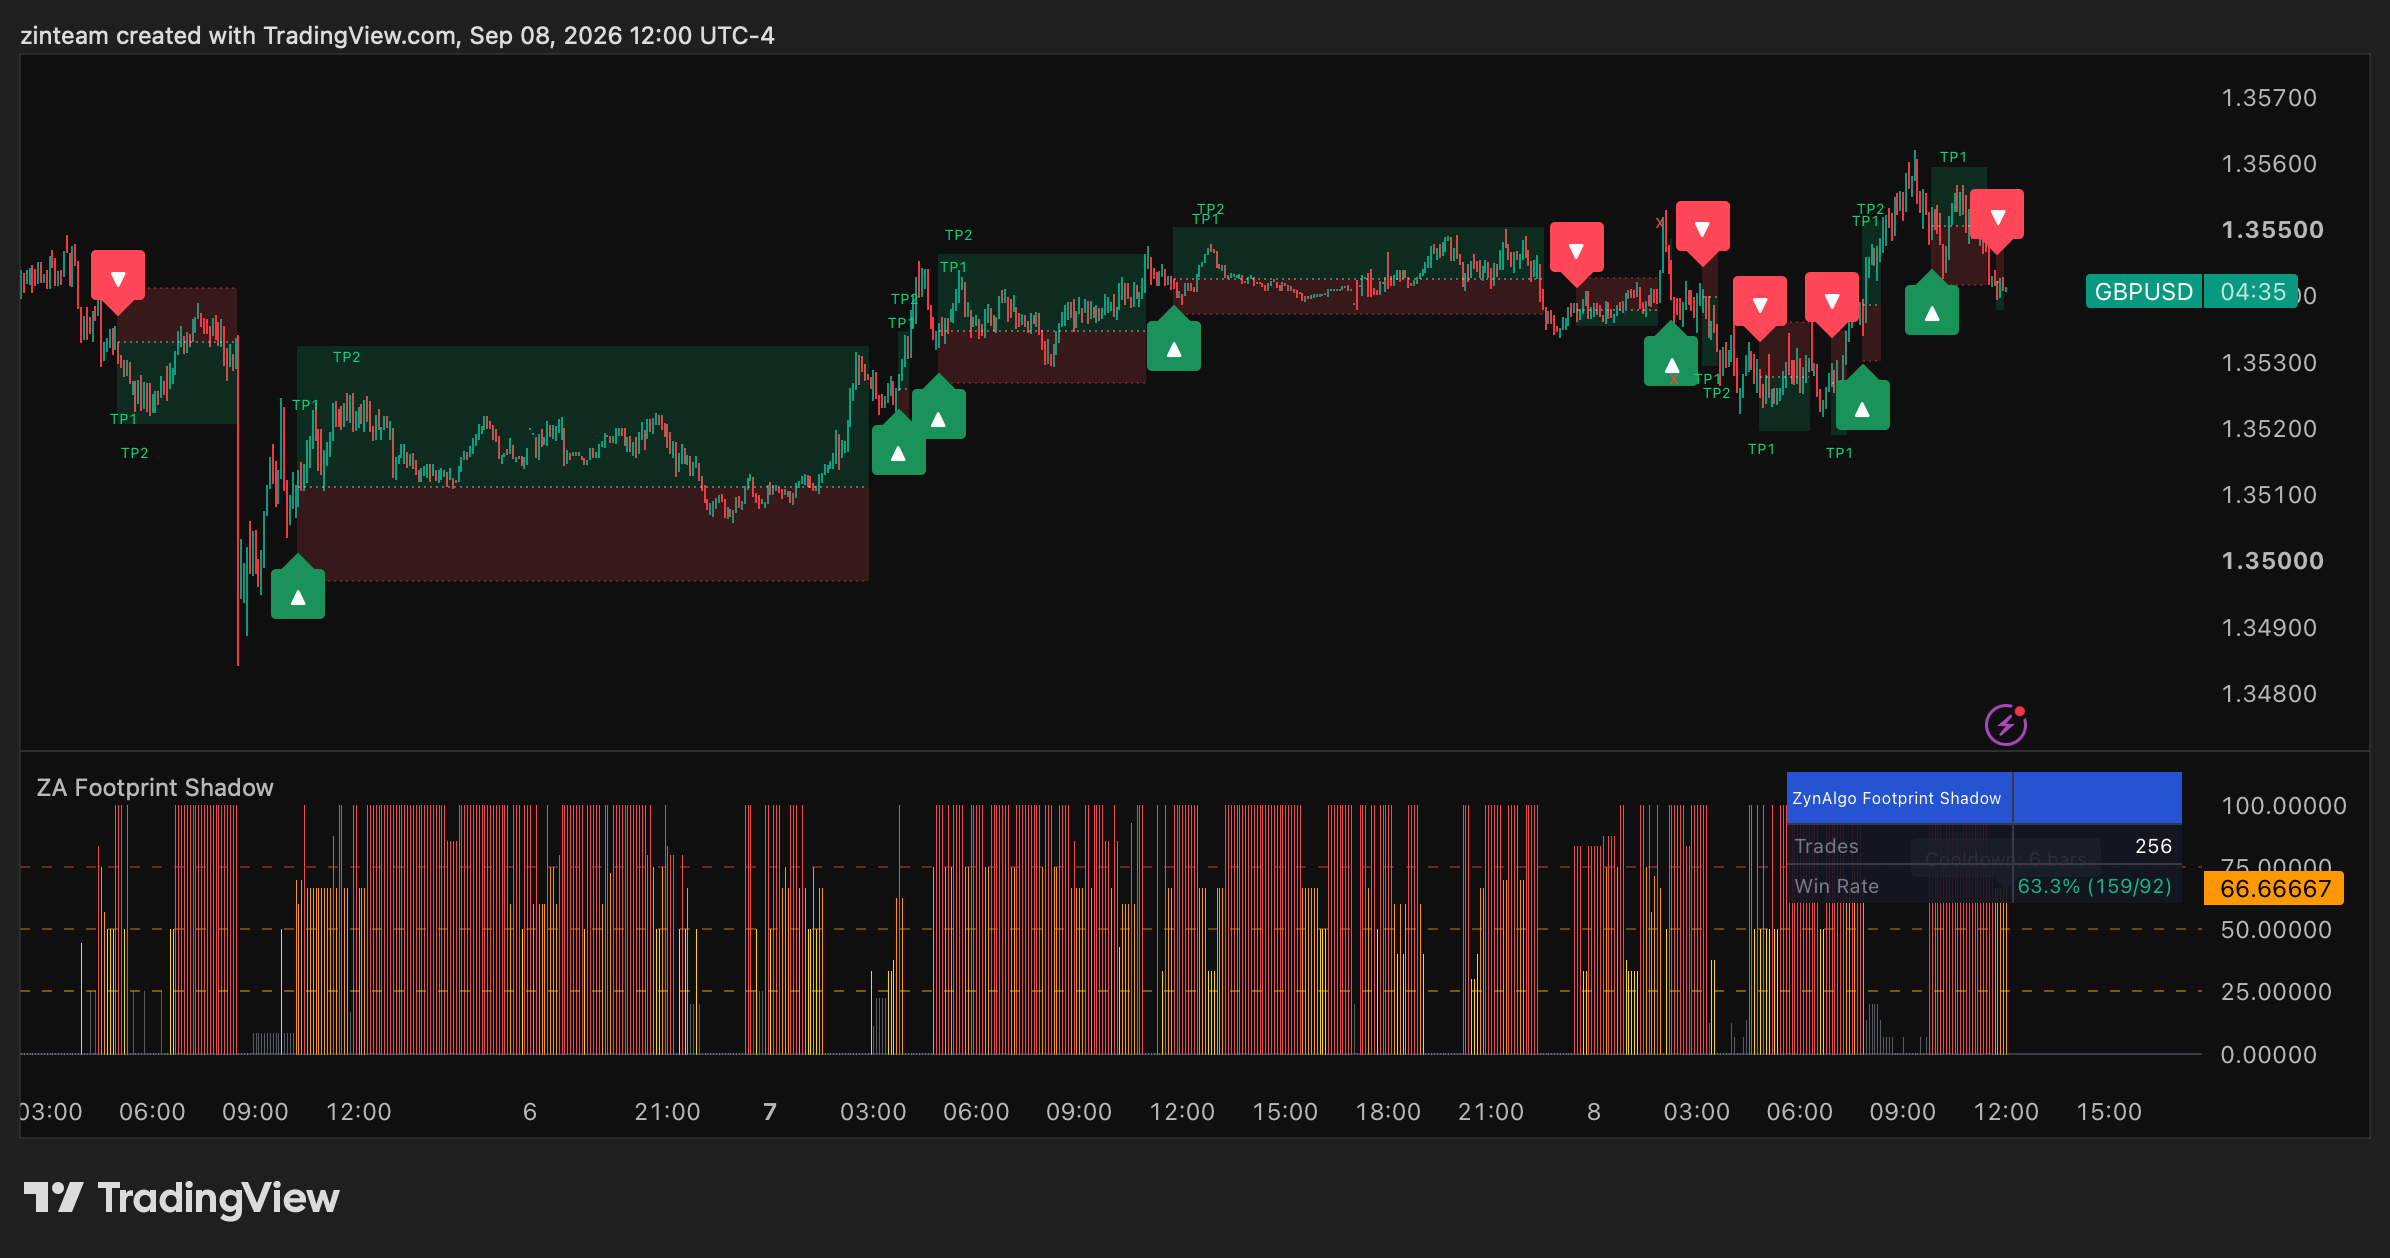
A ▼ marker (red, above the bar) is the mirror image: a bearish rejection candle whose upper wick dominates, inside a zone above the threshold, with a bearish trend gate and the same stability, alternation and cooldown checks. Its hover text reads "Footprint zone (resistance)".
With Show TP/SL Box on, each marker gets a position box: green from the entry to the next open target, red from the entry to the stop, with a dotted white entry line and a dotted red stop line. The stop sits Stop Loss (x ATR) from the entry; targets are TP1 (R), TP2 (R) and TP3 (R) multiples of that distance, with Enable TP2 and Enable TP3 as switches. Each target reached prints a tiny green "TP1", "TP2" or "TP3" label (Show TP/SL Result Labels) and extends the green box to the next target. A stop hit before any target prints a small red "x" and replaces the marker's hover text with "SL -1R"; after a target was reached, the hover text records that target instead. A position that reaches neither side within Max Trade Duration (Bars, timeout) closes quietly. Alerts: New Move Completed, BUY and SELL.
Tuning how often markers appear. Too few signals: lower Min Footprint Strength for Signal - from 0.5 to 0.25, for instance - so Medium pockets also qualify, or soften Min Wick Ratio for Rejection Candle. Want the pockets themselves built from larger, less noisy legs: raise Swing Pivot Length. Want more history in the reading: raise Max Shadow Profiles Remembered, accepting that older pockets then influence Footprint Strength too. And when a setup looks valid but nothing prints, turn on Show Cooldown Countdown on Chart - the label on the last bar tells you how many bars the cooldown still blocks, which rules out the most common cause.
Is Price Footprint Shadow right for you?
- Level traders who want evidence, not lines: zones come from where price actually lingered, not hand-drawn horizontals.
- Reversal and pullback traders: you buy dips into support and sell rallies into resistance, and want the candle to prove the level first.
- Traders on instruments without reliable volume data: the footprint is built from bar ranges, so it behaves the same on FX, crypto, indices and CFDs.
- Swing and intraday traders who like fewer markers: cooldown, stability and alternation filters keep the chart quiet between real setups.
A strong footprint tells you where to pay attention; the rejection candle tells you when. Acting only where both agree is the whole point - location quality over marker quantity.
Browse the ZynAlgo marketplace
Risk note: Price Footprint Shadow [ZynAlgo] is a decision-support tool, not a trading system or financial advice. The TP/SL box is an internal simulation drawn for illustration, signals can fail and no indicator removes market risk - always use your own stop placement and position sizing.
No release notes have been published yet.




