
Hourly Volatility Heatmap [ZynAlgo]
Built for traders who want to fade liquidity sweeps only in the hours that historically matter, without guessing which part of the day is live. Hourly Volatility Heatmap [ZynAlgo] is an hourly volatility heatmap indicator for TradingView that ranks all 24 hours by real range and reversal frequency, then prints ▲ / ▼ reversal markers only inside the hottest ones.
Key benefits
- Time-aware signals: a sweep-and-reject setup only counts when the data says that hour tends to move and turn.
- Seasonal direction check: each hour's historical bullish or bearish lean can gate BUY versus SELL, so you trade with the hour's tendency.
- Momentum confirmation: an optional RSI divergence filter drops sweeps that carry no exhaustion.
How it works
A rolling window of days records, for every hour, the average bar range, how often it held the day's high or low, and the share of bullish closes. Range and reversal frequency are scaled and averaged into a heat score that colours a 24-cell dashboard and ranks the top hours. Inside a top-ranked hour, a bar that breaks a recent swing high or low and closes back against it prints a marker on the next bar, with the reason on hover. Full walkthrough in the Manual.
What's included / Platforms
- TradingView indicator, Pine Script v6, free and open-source - add it to your chart from the public TradingView library.
Suitable for
Forex majors, gold, indices and crypto CFDs on intraday timeframes (H1 and below, given the hourly-bucket design) - the tool needs intraday bars to build its 24-hour statistics.
Tested
Confirmed running live on TradingView on XAUUSD and BTCUSDT (15m).
Best for
Intraday traders on forex, gold, indices and crypto who want a data-driven hour filter on top of a liquidity-sweep reversal setup.
Get started
Browse the ZynAlgo marketplace
Disclaimer: for research and education only, not financial advice. Signals can fail and no indicator removes market risk - trade with your own plan and position sizing.
Hourly Volatility Heatmap [ZynAlgo]
What Hourly Volatility Heatmap [ZynAlgo] does differently
Most reversal tools look only at the candle. Hourly Volatility Heatmap [ZynAlgo] starts with the clock. It keeps a rolling record of how each hour of the day has behaved - how much range it produced, how often it printed the day's high or low, and whether it leaned bullish or bearish - and turns that record into a 24-cell heat table on your TradingView chart. Signals are allowed only inside the hottest hours: a sweep of a recent swing high or low that is rejected on the close, optionally confirmed by the hour's directional bias and an RSI divergence, prints a ▲ or ▼ marker with its reason on hover. The philosophy: a rejection candle means more in an hour that repeatedly moves and turns than in one that drifts, so let the data pick the hours before you pick the trade.
How Hourly Volatility Heatmap [ZynAlgo] reads the trading day
The core of the tool is the Hot Hour score. Every instrument has hours that carry the day - where range expands and the daily high or low is most often set - and hours that mostly consolidate. The heat table makes that difference visible and feeds it straight into the signal logic.
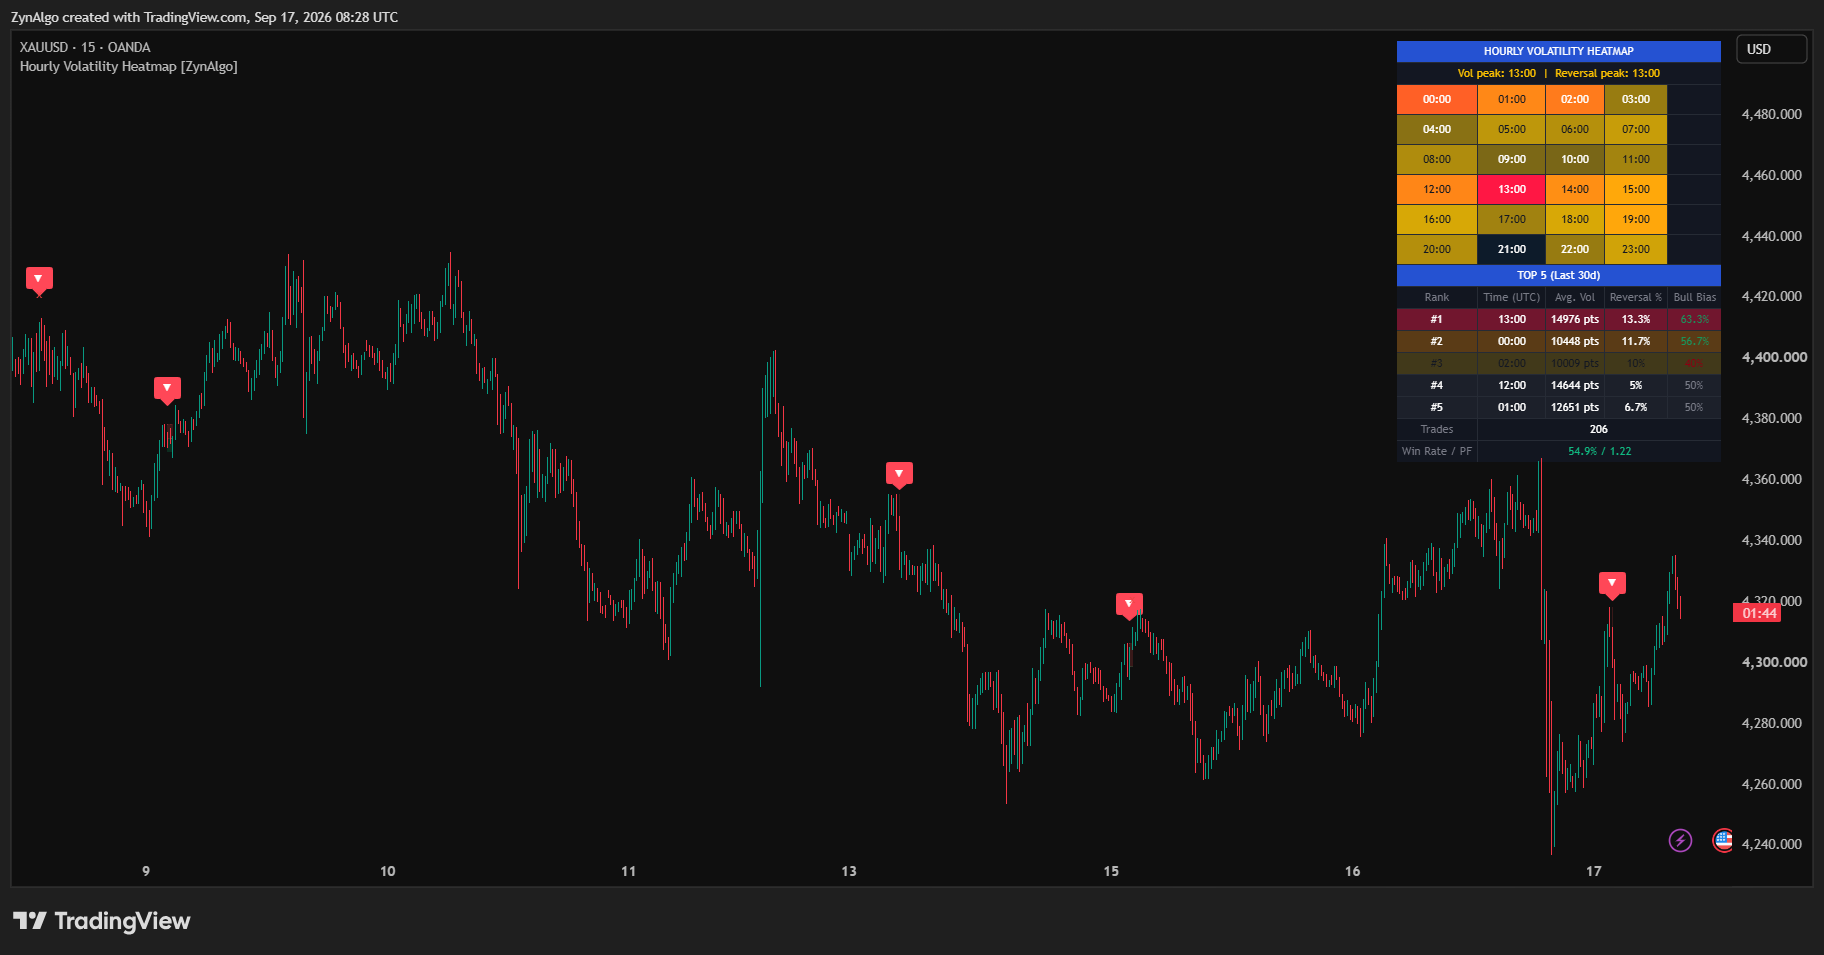
What you see on the chart and in the dashboard:
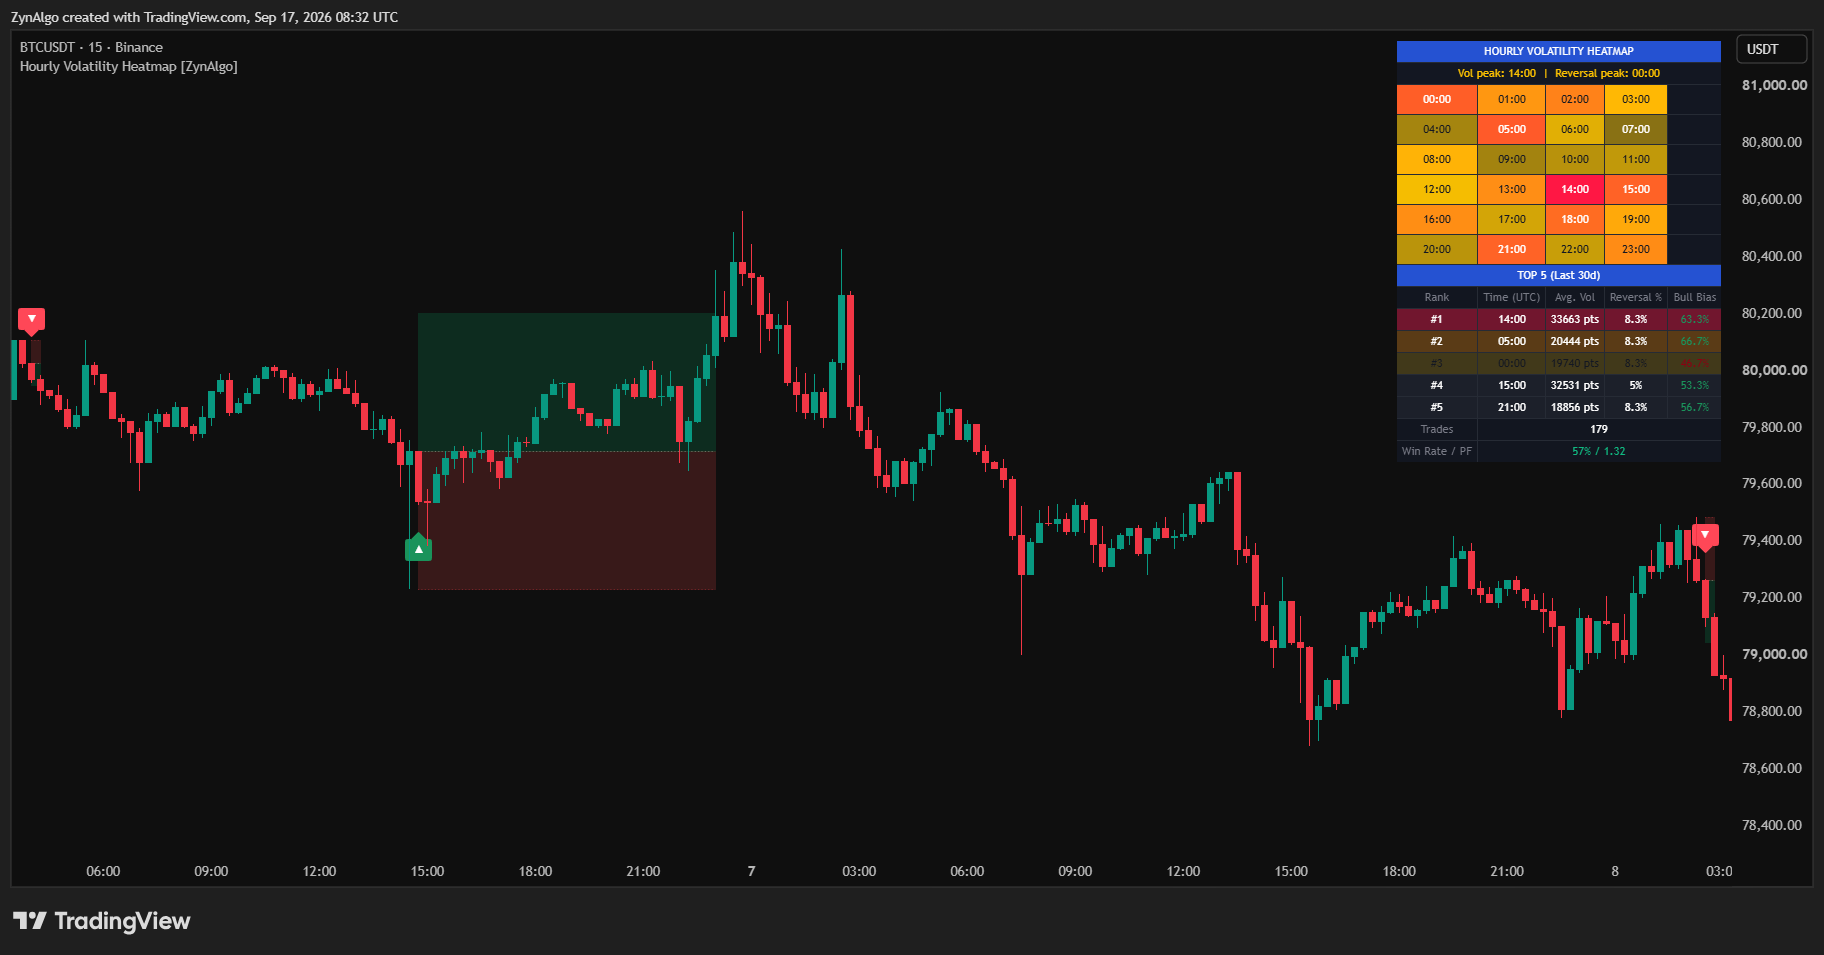
- a panel titled "HOURLY VOLATILITY HEATMAP" in the corner you choose, with a yellow insight line "Vol peak: HH:00 | Reversal peak: HH:00";
- a 6 x 4 grid of the 24 hours, each cell shaded from dark navy (cold) through amber (mid) to red (hot) by its Hot Hour score;
- a "TOP 5 (Last Nd)" table with Rank, Time (in your timezone), Avg. Vol in points, Reversal % and Bull Bias, the bias printed green above 50% and red below it;
- a green ▲ marker below the bar for a BUY and a red ▼ marker above the bar for a SELL, each with a tooltip that spells out the reason.
Common mistake: reading a red cell as a direction. Heat measures activity and turning-point frequency, not up or down. The only directional read is the Bull Bias column, and it gates the signal rather than forecasting.
How the Hot Hour score is defined
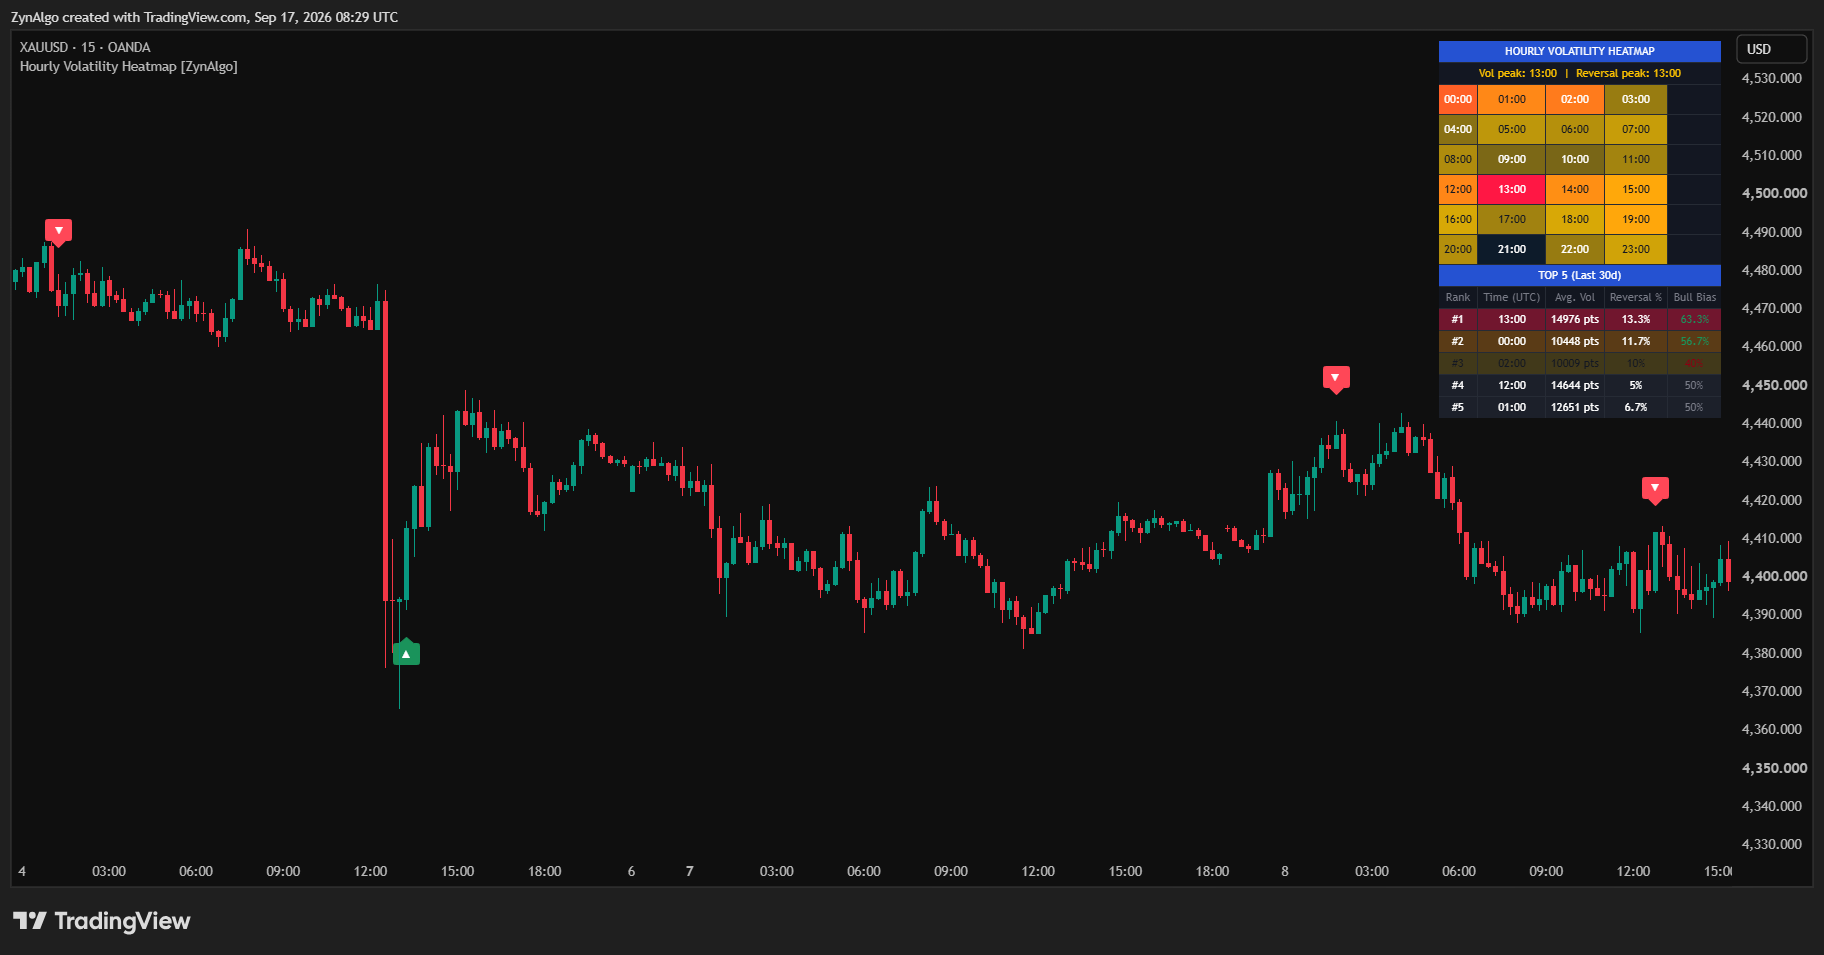
- Timezone (UTC Offset): every bar is stamped with its hour in the zone you select, so the table matches your own clock.
- Lookback Days: the rolling window of completed days (default 30); statistics are rebuilt at the start of each new day.
- Average range per hour: the high-to-low range of each bar, in points, averaged per hour across the window - the "Avg. Vol" column.
- Reversal %: how often that hour held the day's high or low across the window (each day contributes one high hour and one low hour).
- Hot Hour score: average range and Reversal % are each scaled 0-100 against the best hour, then averaged. This score colours the cells and ranks the hours; Hot Hours Filter (Top N by combined score) sets how many top-ranked hours may signal (default 5).
- Bull Bias: the share of tracked hourly candles in that slot that closed above their open, used by Enable Directional Bias Filter.
- Swing Length (bars) and RSI Length: define the structure sweep and the divergence check used in the next section.
When trading opportunities appear inside a hot hour
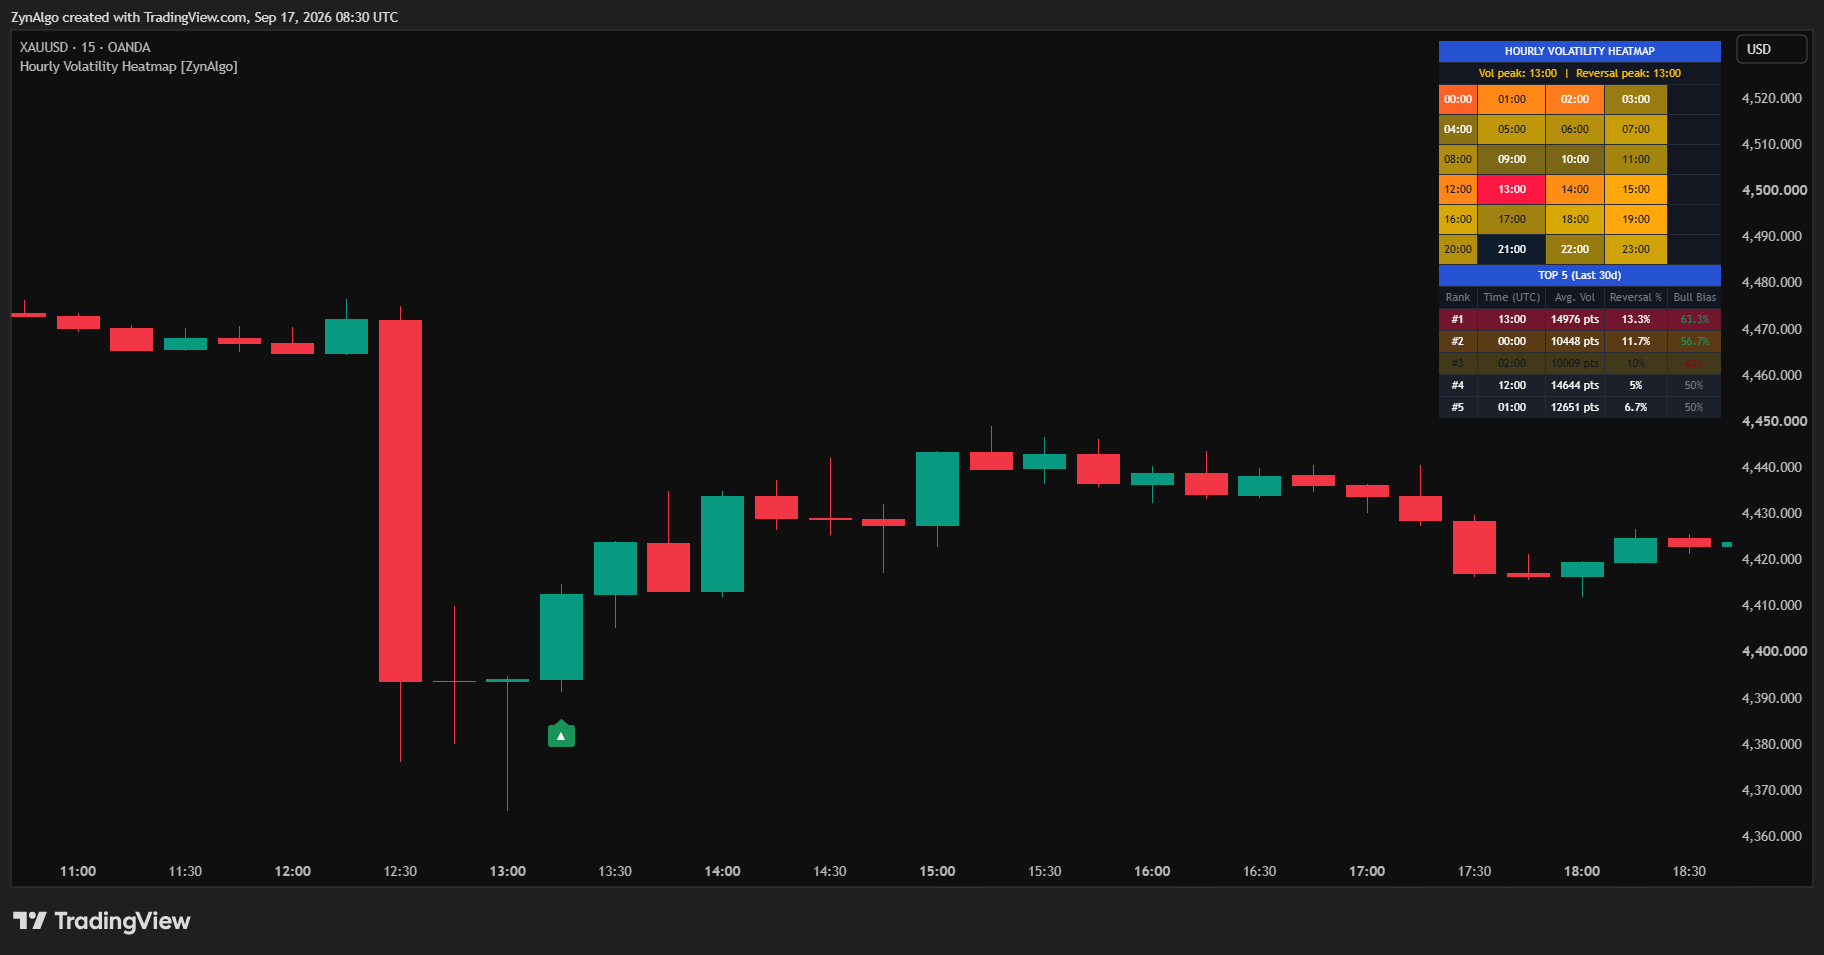
A BUY setup requires all of the following on a closed bar:
- the current hour is one of the Top N hot hours by Hot Hour score;
- the bar's low reaches or breaks the lowest low of the previous Swing Length bars (current bar excluded) and the bar closes above its open - a sweep of the low that was rejected;
- if Enable Directional Bias Filter is on, the hour's Bull Bias is at or above 50%;
- if Enable RSI Divergence Filter is on, RSI on this bar is higher than RSI was on the bar that set the swept low - a bullish divergence;
- at least Cooldown (Bars) bars have passed since the previous signal.
When these hold, the ▲ marker prints on the next bar, whose open is the entry reference; the stop reference is the low of the sweep bar. If that next bar opens through the stop reference, the setup is discarded. Hover the marker to read the reason, for example: "Buy: 14:00 (UTC) is a Top 5 hot hour. (Bias Check: 58.3% Bullish) [RSI Divergence Confirmed] Price made a 5-bar low and rejected."
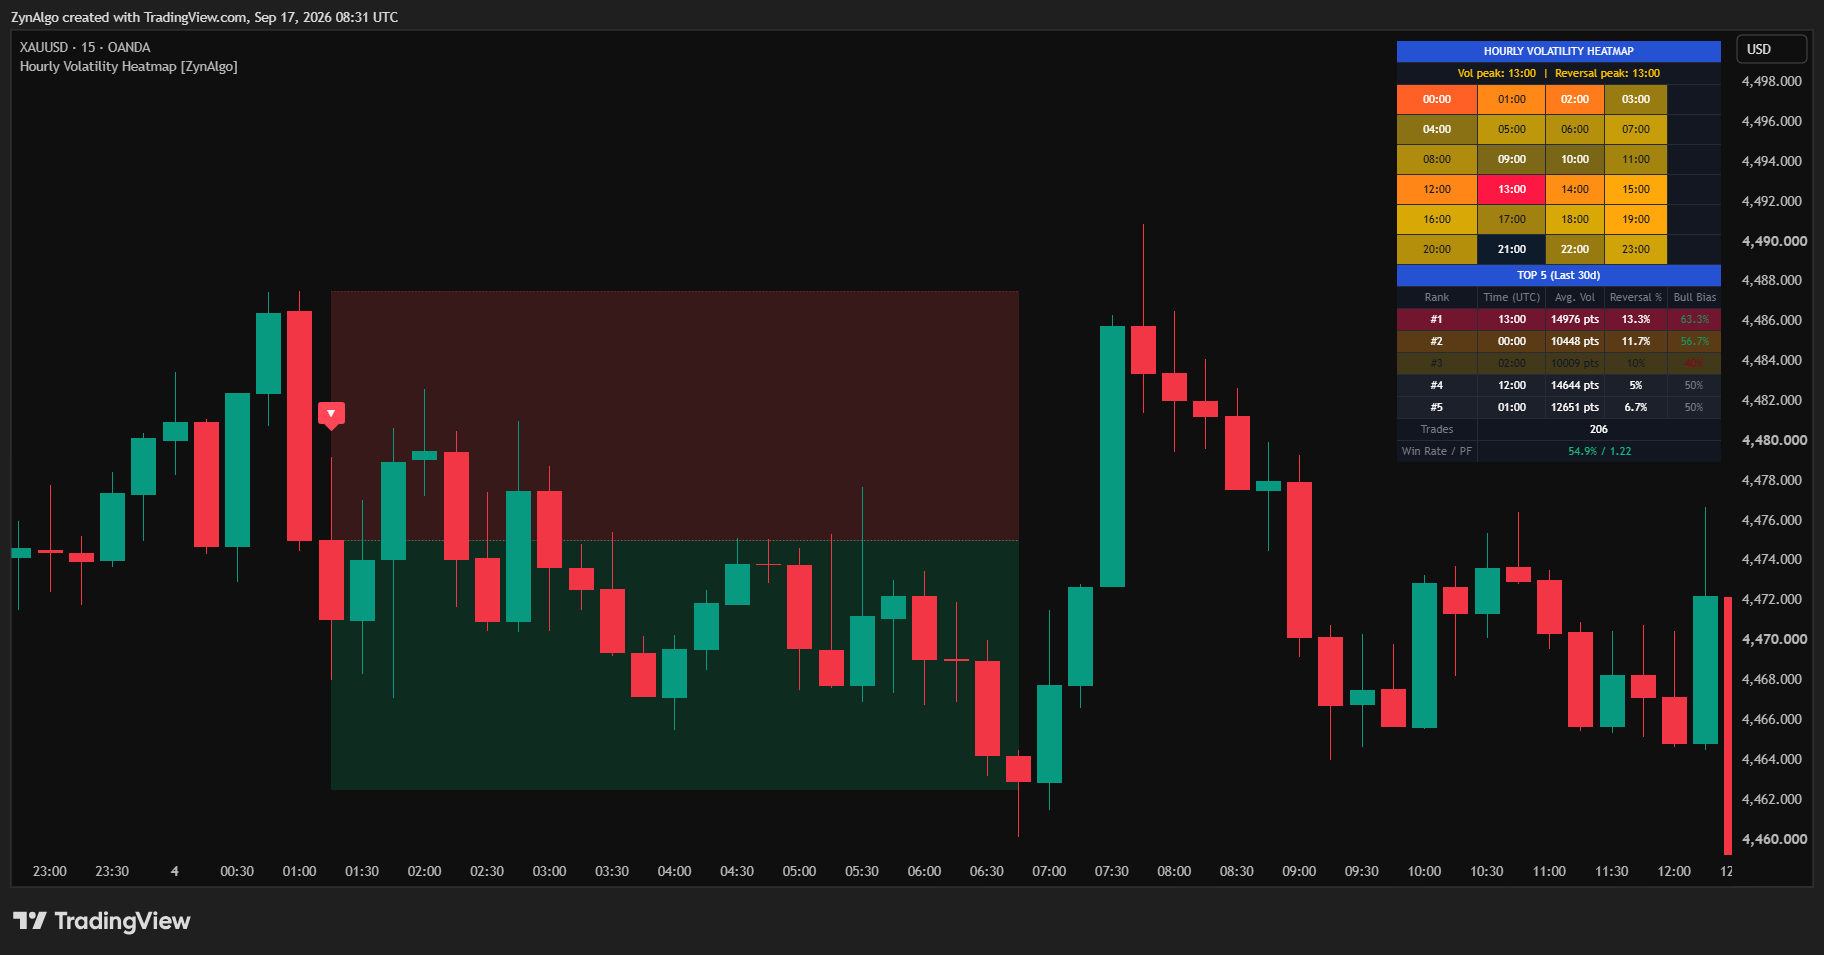
A SELL setup is the mirror image: a top-ranked hour, the bar's high reaches or breaks the highest high of the previous Swing Length bars and the bar closes below its open, Bull Bias at or below 50% if the bias filter is on, RSI lower than it was at the swept high if the divergence filter is on, and the cooldown satisfied. The red ▼ marker prints above the next bar with the same style of reason on hover.
Enable Trade Mode is off by default: the chart shows markers and tooltips only, and Stability Mode and Smart Signal Filter are bypassed. Switch it on and each marker becomes a tracked position - a red-tinted risk box from entry to stop, a green-tinted reward box from entry to the final target (TP3 (R) if Enable TP3 is on, otherwise TP2 (R), otherwise TP1 (R)), a dotted white entry line and a dotted red stop line that steps to the entry after TP1 and to TP1 after TP2. Small green "TP1" / "TP2" tags mark those moments, a red "x" marks a trade stopped out before any target, Max Trade Duration (Bars) closes a stale position, and the marker tooltip is updated with how the trade finished. Stability Mode (no new signal while a trade is open) and Smart Signal Filter (force alternating Buy/Sell) then gate new entries, and Max Stored Trade Records (history) caps the drawings kept. The panel also grows two rows - Trades (total tracked) and Win Rate / PF (win percentage and Profit Factor from this internal simulation) - so you can see, at a glance, how the current settings would have performed over the visible history. The Hourly Volatility Heatmap Buy and Sell alert conditions fire on the sweep bar itself.
Note: the Trades / Win Rate / PF figures are a non-executed internal simulation over the chart's visible history, not a backtest report or a broker statement, and not indicative of future results.
Is Hourly Volatility Heatmap [ZynAlgo] right for you?
- Session-aware intraday traders: you know not every hour is worth trading and want that judgement backed by the instrument's own numbers, not a fixed session template.
- Liquidity-sweep and reversal traders: your setup is a run through a recent high or low that fails, filtered here by time, seasonal bias and momentum.
- Traders on 24-hour markets: forex, gold, index CFDs and crypto all have hours that concentrate range and turning points; the table finds them per symbol.
- Traders who prefer fewer, better-timed marks: the hot-hour gate, the bias check and the cooldown remove most sweeps that occur in dead hours.
The tool needs intraday bars to build its hourly statistics, so use it on hourly and lower timeframes. A marker is a well-timed candidate, not an order - the edge is in reserving a good reversal pattern for the hours where the instrument has actually been moving and turning.
Browse the ZynAlgo marketplace
Risk note: Hourly Volatility Heatmap [ZynAlgo] is a decision-support tool, not a trading system or financial advice. Hour statistics can shift, signals can fail and no indicator removes market risk - always use your own stop placement and position sizing.
No release notes have been published yet.




