
MACD Dynamic Squeeze Pro
Stop reacting to every MACD cross. MACD Dynamic Squeeze Pro helps you separate the crosses that follow a real compression in momentum from the ones that do not.
Key benefits
- Fewer signals to judge: a cross is only marked when momentum has just compressed and the trend agrees with it.
- Nothing hidden: ordinary crosses still print as faded dots, so you can see exactly what was filtered out.
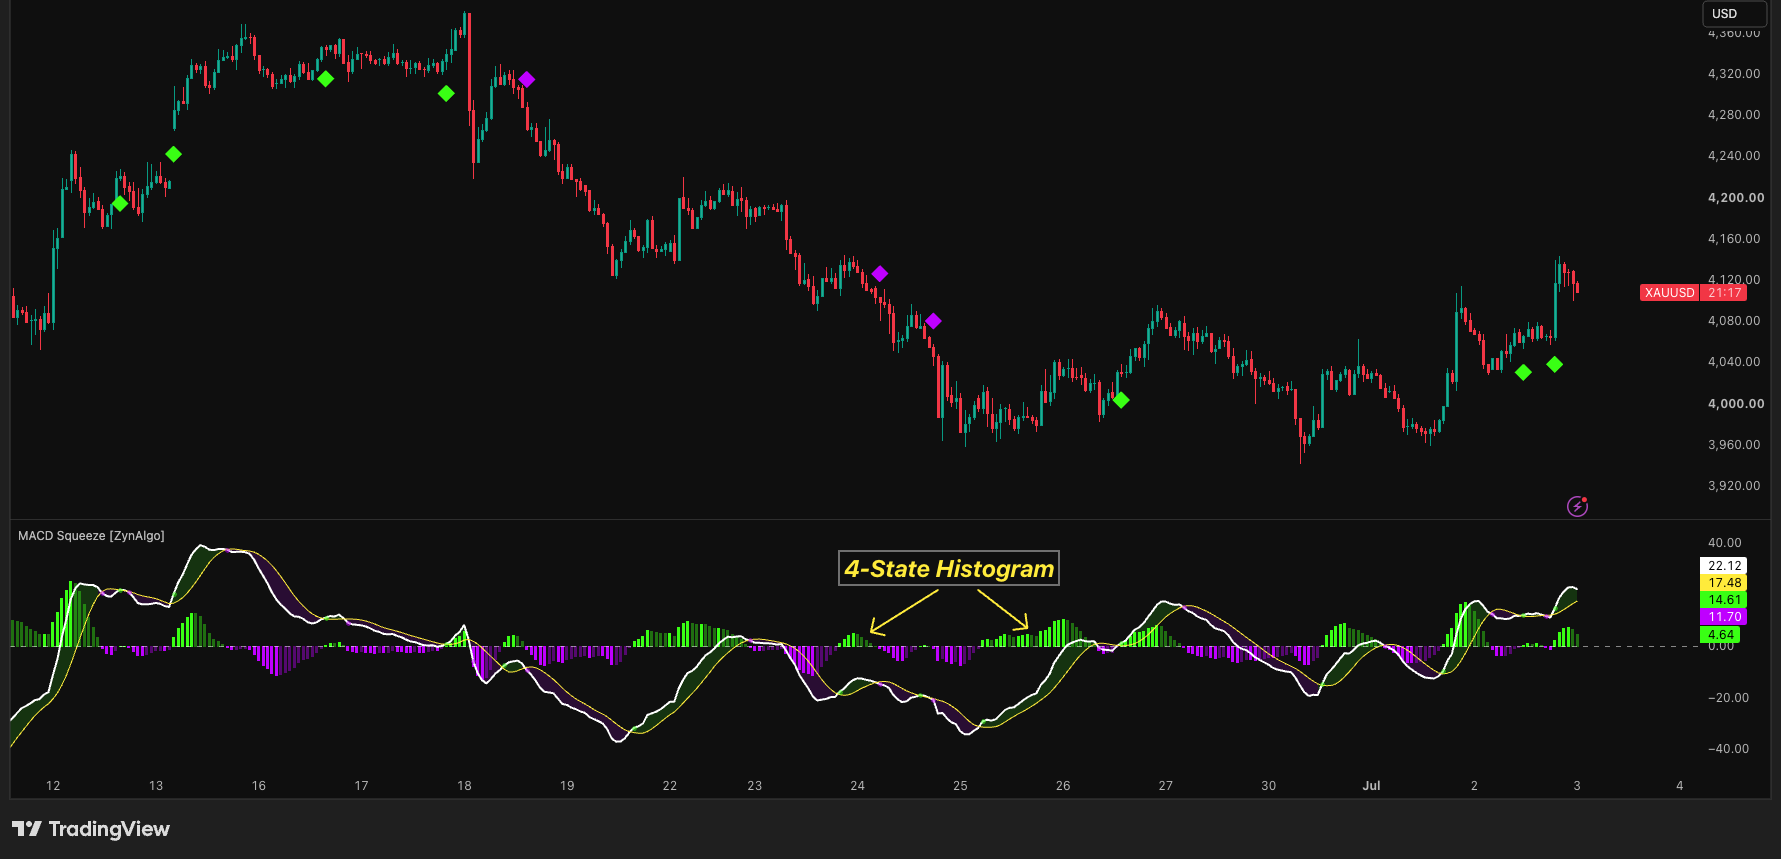
- Momentum at a glance: a four-state histogram separates pressure that is building from pressure that is fading.
How it works The indicator measures how small the MACD histogram has become against its own recent average. When a cross arrives shortly after that compression, on the correct side of the zero line, a diamond is printed on the chart. Full walkthrough is in the Manual.
What's included / Platforms TradingView version (public script, no access request needed). Free to add to your chart.
Best for Trend and continuation traders on intraday to daily charts, in markets that alternate between quiet phases and expansion.
Get started Add MACD Dynamic Squeeze Pro from the ZynAlgo marketplace and open it in a pane below your chart.
Disclaimer: trading involves risk; past performance does not guarantee future results.
MACD Dynamic Squeeze Pro
Where MACD Dynamic Squeeze Pro fits on your chart
A standard MACD crosses constantly. Most of those crosses happen while momentum is already stretched, or while price is chopping either side of the zero line, and acting on all of them is exhausting.
MACD Dynamic Squeeze Pro keeps the familiar MACD calculation and adds one question on top: had momentum gone quiet just before this cross? It tracks how small the histogram has become relative to its own recent average, checks that the whole oscillator is sitting on one side of zero, and only then marks the cross.
Everything else stays visible. Unqualified crosses are still plotted, just faded, so the pane shows you both what was selected and what was passed over on TradingView.
What builds a Zyn Explosion
A Zyn Explosion is the name for a cross that survived all three checks. It is not a new calculation - it is a filter placed over the MACD you already know.
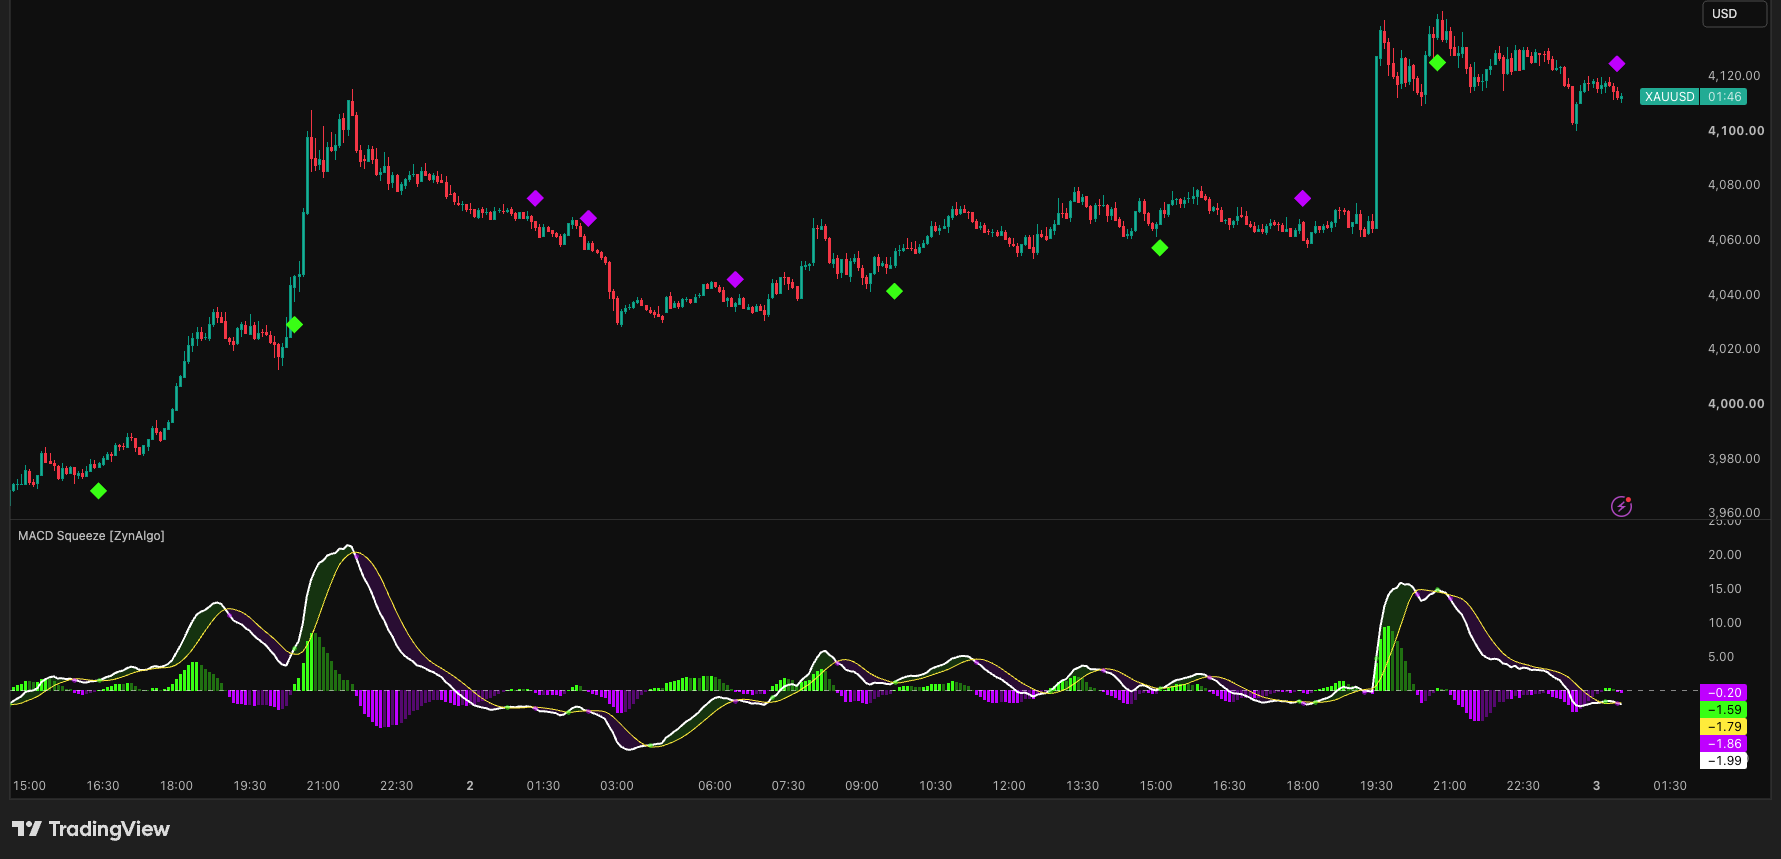
- Compression first. Momentum has to shrink before it can expand. The histogram falling well under its own average is the sign that the market has gone quiet.
- Direction second. A compression that resolves against the prevailing side of the zero line is far less useful, so the oscillator has to already be positioned.
- Trigger last. The cross itself is only the timing element, not the reason.
The mistake this is designed around is treating the cross as the signal. In a quiet market the MACD line and its signal line brush against each other repeatedly and mean almost nothing. The compression is what gives the eventual cross its context.
How a Zyn Explosion is defined
- Fast, Slow and Signal Length - the underlying MACD settings, 12, 26 and 9 by default.
- Momentum Average Length - the window used to average the size of the histogram, twenty bars by default. This average is the compression baseline.
- Squeeze Compression Ratio - how far under that average the histogram must fall to count as squeezed. At the default of 0.5 it has to drop below half its own average size.
- Squeeze Valid Lookback - how many bars the squeeze stays valid for, three by default. Cross later than that and the compression no longer counts.
- Trend filter - both the MACD line and the signal line must be above zero for a bullish explosion, or both below zero for a bearish one.
Trading the Zyn Explosion
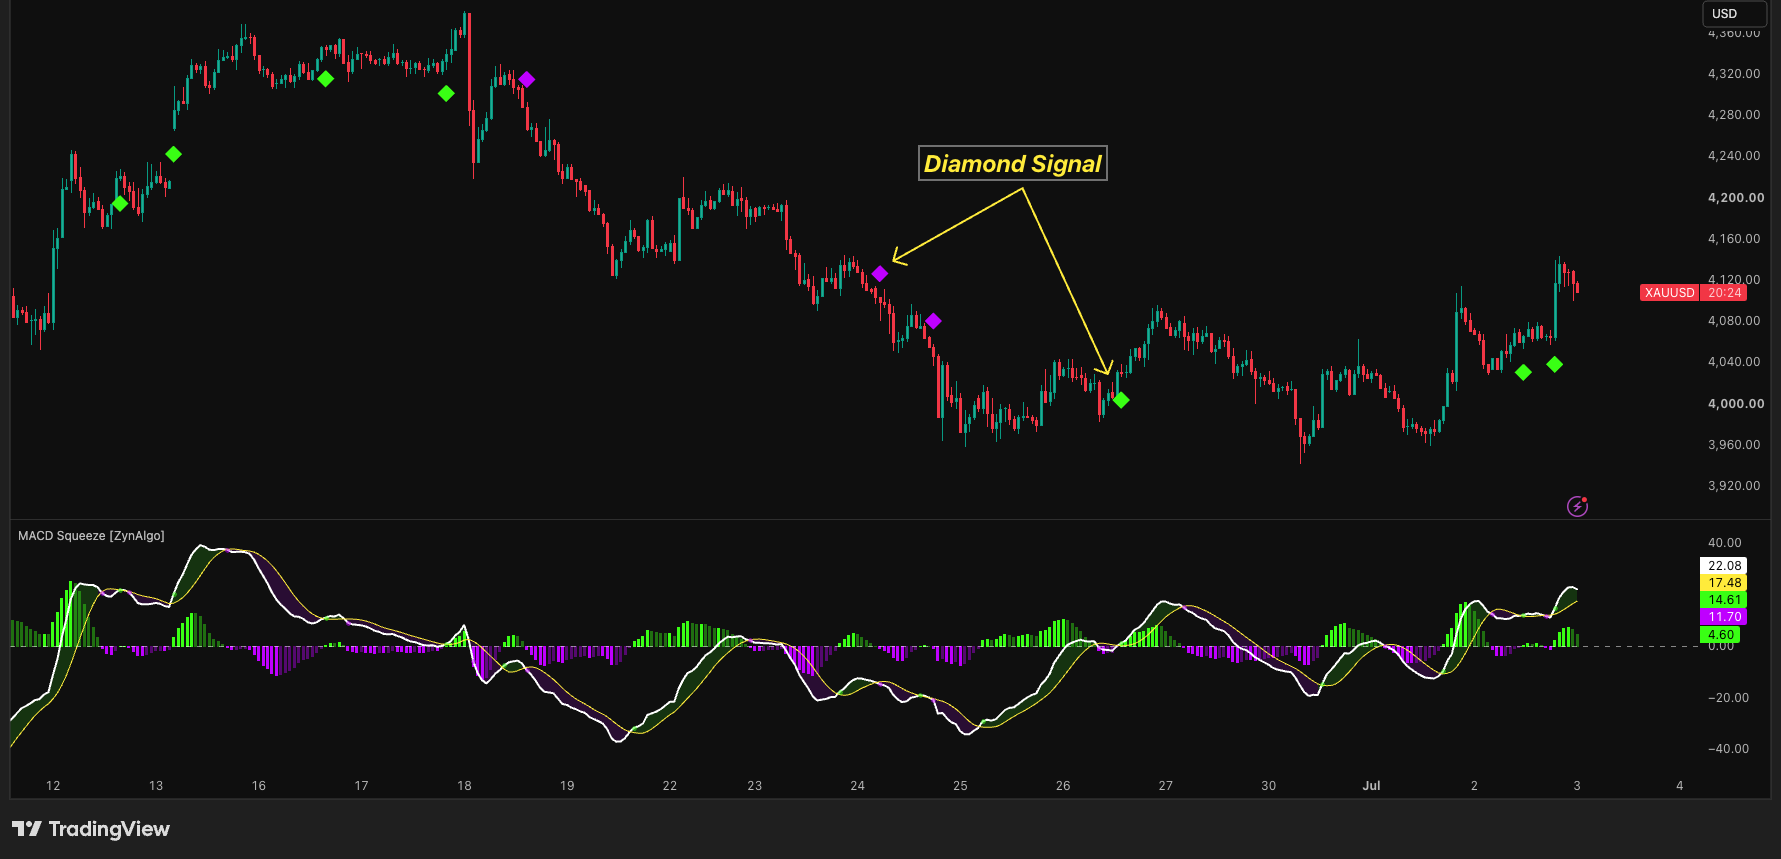
When all three conditions line up, a diamond is printed on the price chart: below the bar for a bullish explosion, above the bar for a bearish one.
- Bullish explosion - the MACD line crosses above its signal line while both sit above zero, within three bars of a completed squeeze.
- Bearish explosion - the MACD line crosses below its signal line while both sit below zero, within three bars of a completed squeeze.
Read the histogram colour alongside the diamond. The histogram uses four states rather than two: bright when the bar is extending away from the signal line and faded when it is pulling back toward it, on both sides of zero. A diamond arriving as the histogram brightens is a cleaner picture than one arriving as it fades.
The faded circles marking every ordinary cross are there on purpose. If the pane shows a run of faded circles and no diamonds, the market is crossing without compressing, and that in itself is information about conditions.
Note that the diamond marks the bar where the cross completed. Give the cross the bar close before treating it as final, in the same way you would with any crossover tool.
Where this fits in your workflow
- Trend and continuation traders who want a smaller set of MACD signals to look at.
- Markets that alternate between quiet phases and expansion - index futures, major crypto pairs and liquid equities all show this rhythm clearly.
- Intraday to daily charts. On very fast timeframes the compression test triggers often enough to lose some of its meaning.
- Traders who already work with MACD and want the same tool to be more selective, rather than a new system to learn.
By design this indicator says nothing most of the time. A quiet pane means conditions did not meet the criteria, which is the intended behaviour and not a fault. Pair it with your own levels and risk rules.
Browse the full catalogue on the ZynAlgo marketplace.
No release notes have been published yet.





