
Footprint Master Pane
A volume bar tells you how much traded on a candle. Footprint Master Pane also tells you where inside that candle it traded, and which side was leaning on it.
Key benefits
- See inside the candle: every bar is rebuilt as a stack of price levels instead of one number.
- Find the level that mattered: the heaviest level in each column is highlighted automatically.
- Read the lean: buy-heavy and sell-heavy levels are coloured apart, with a delta total under every column.
How it works Footprint Master Pane pulls intrabar data from a lower timeframe, sorts that volume into a price grid sized to current volatility, and prints the result as one column per bar. Full walkthrough is in the Manual.
What's included / Platforms TradingView version (public script, no access request needed). Free to add to your chart.
Best for Order-flow and volume traders on futures, crypto and liquid equities, working on intraday charts.
Get started Add Footprint Master Pane from the ZynAlgo marketplace and open it in a pane below your chart.
Disclaimer: trading involves risk; past performance does not guarantee future results.
Footprint Master Pane
What Footprint Master Pane puts on your chart
Footprint Master Pane replaces the single volume number under a candle with a breakdown of where that volume actually traded.
It works on one input: intrabar data. The indicator asks TradingView for the smaller candles that make up each bar on your chart, sorts their volume into price levels, and rebuilds every bar as a column of those levels. It does not read momentum, trend or structure, and it produces no buy or sell signals - it is a reading tool, not a signal tool.
What you get on a TradingView pane is a compact order-flow view: which levels inside each bar absorbed the most volume, which side was leaning on them, and how the balance closed out.
A note on the data: buying and selling are estimated from the direction of each intrabar candle, not from exchange bid/ask records. An intrabar that closes flat has its volume split evenly between the two sides. Read the columns as a relative picture of activity rather than a literal order book.
Inside Footprint Master Pane: the footprint column
Each bar on your chart becomes one column in the pane. The column is a fixed ladder of price levels, and every level carries the volume that traded there while the bar was forming.
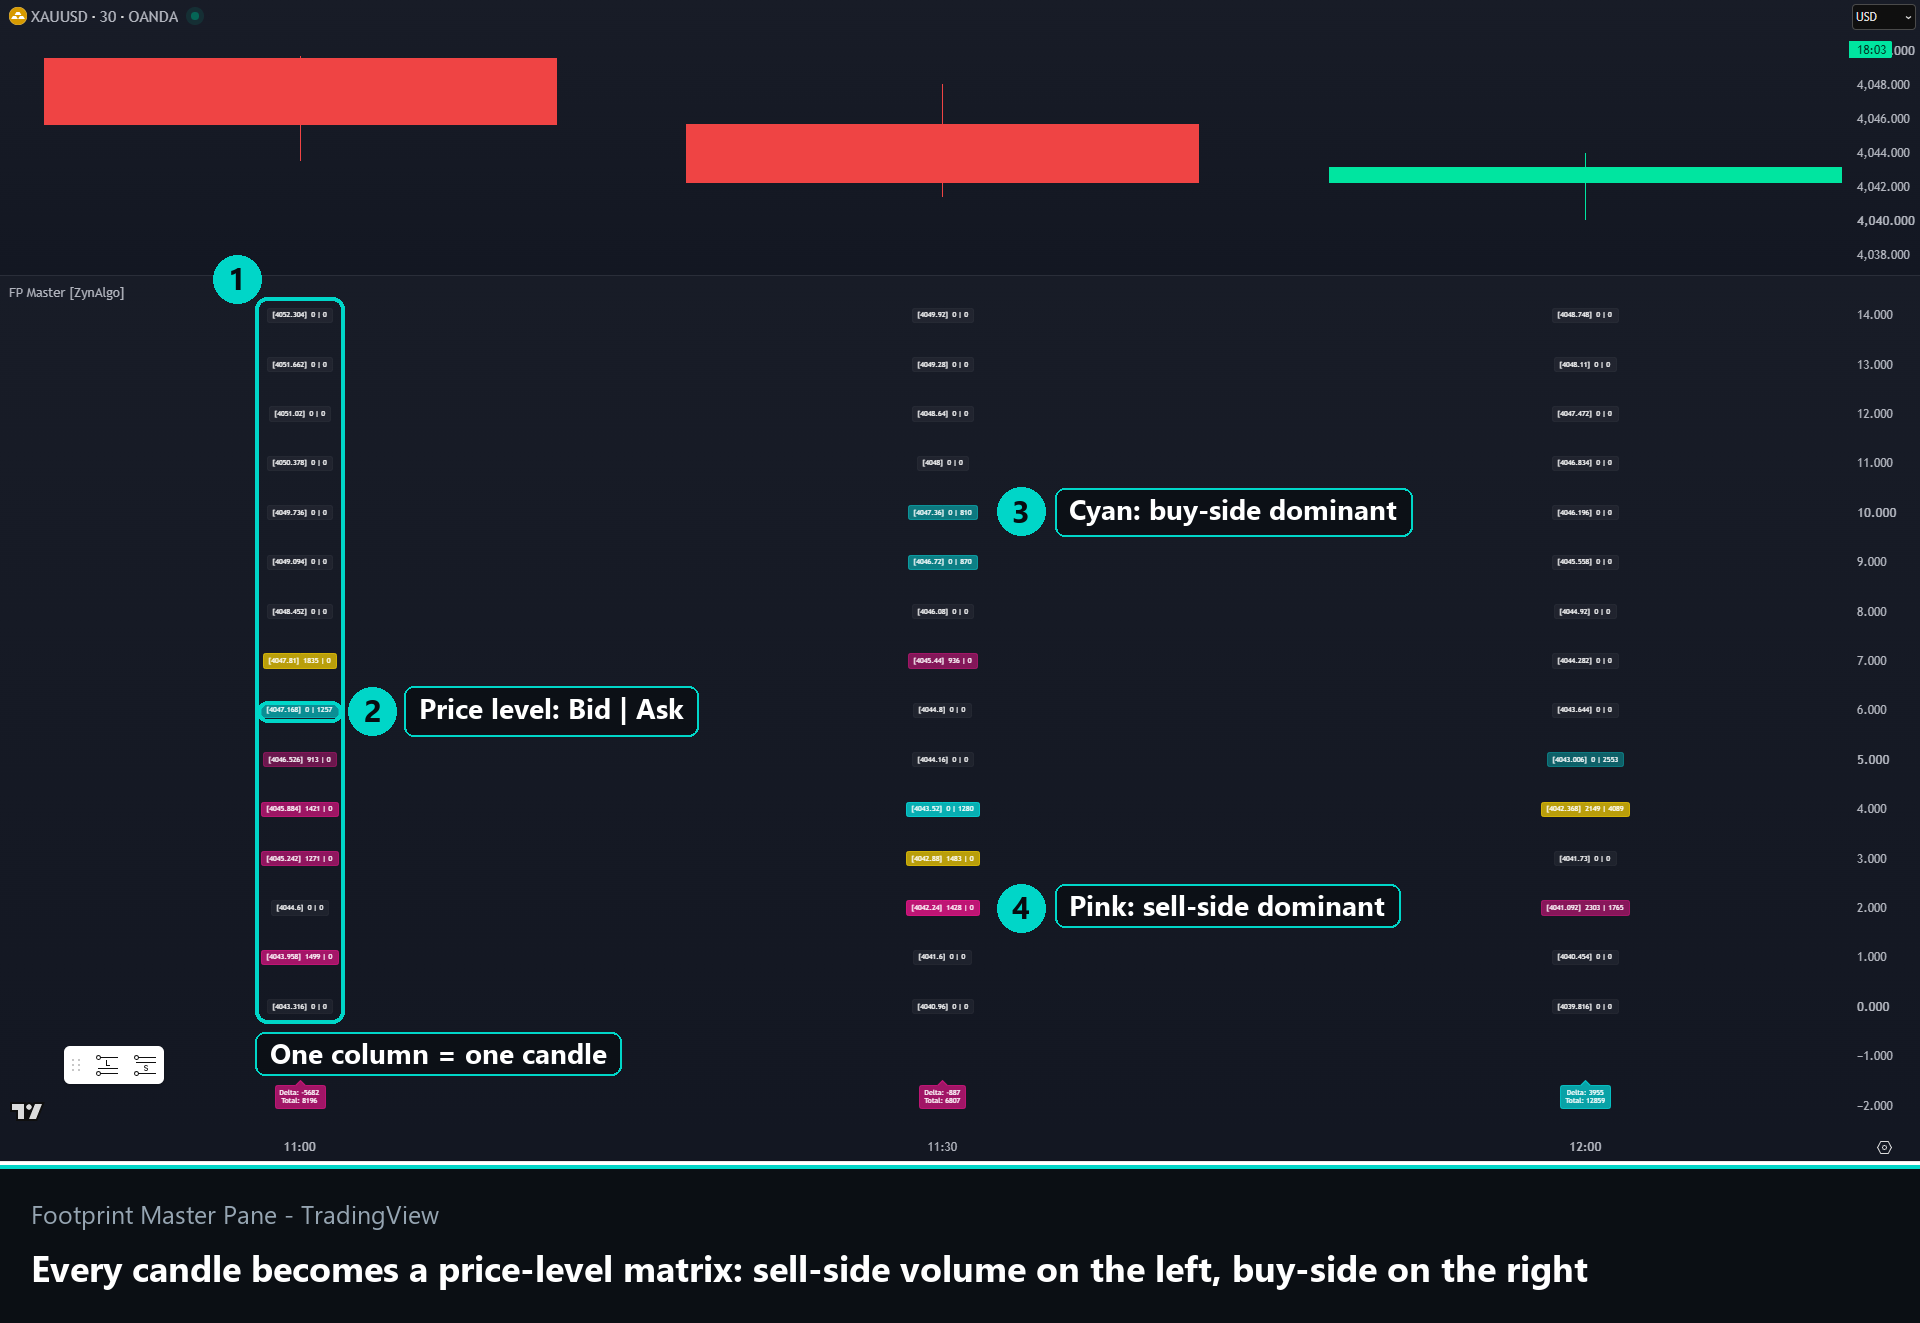
- The brighter a level, the more volume it took relative to the busiest level in that same column.
- Cyan means the buying estimate was larger at that level; pink means the selling estimate was.
- One level in each column is highlighted in gold - the Point of Control, the level that traded the most.
- Each cell prints its price followed by the two figures behind it, selling first and buying second.
The mistake worth avoiding is comparing brightness across columns. Intensity is scaled inside each column against that column's own busiest level, so a bright cell on a quiet bar does not mean more volume than a dim cell on a heavy one. Use the totals in the footer when you want to compare bars.
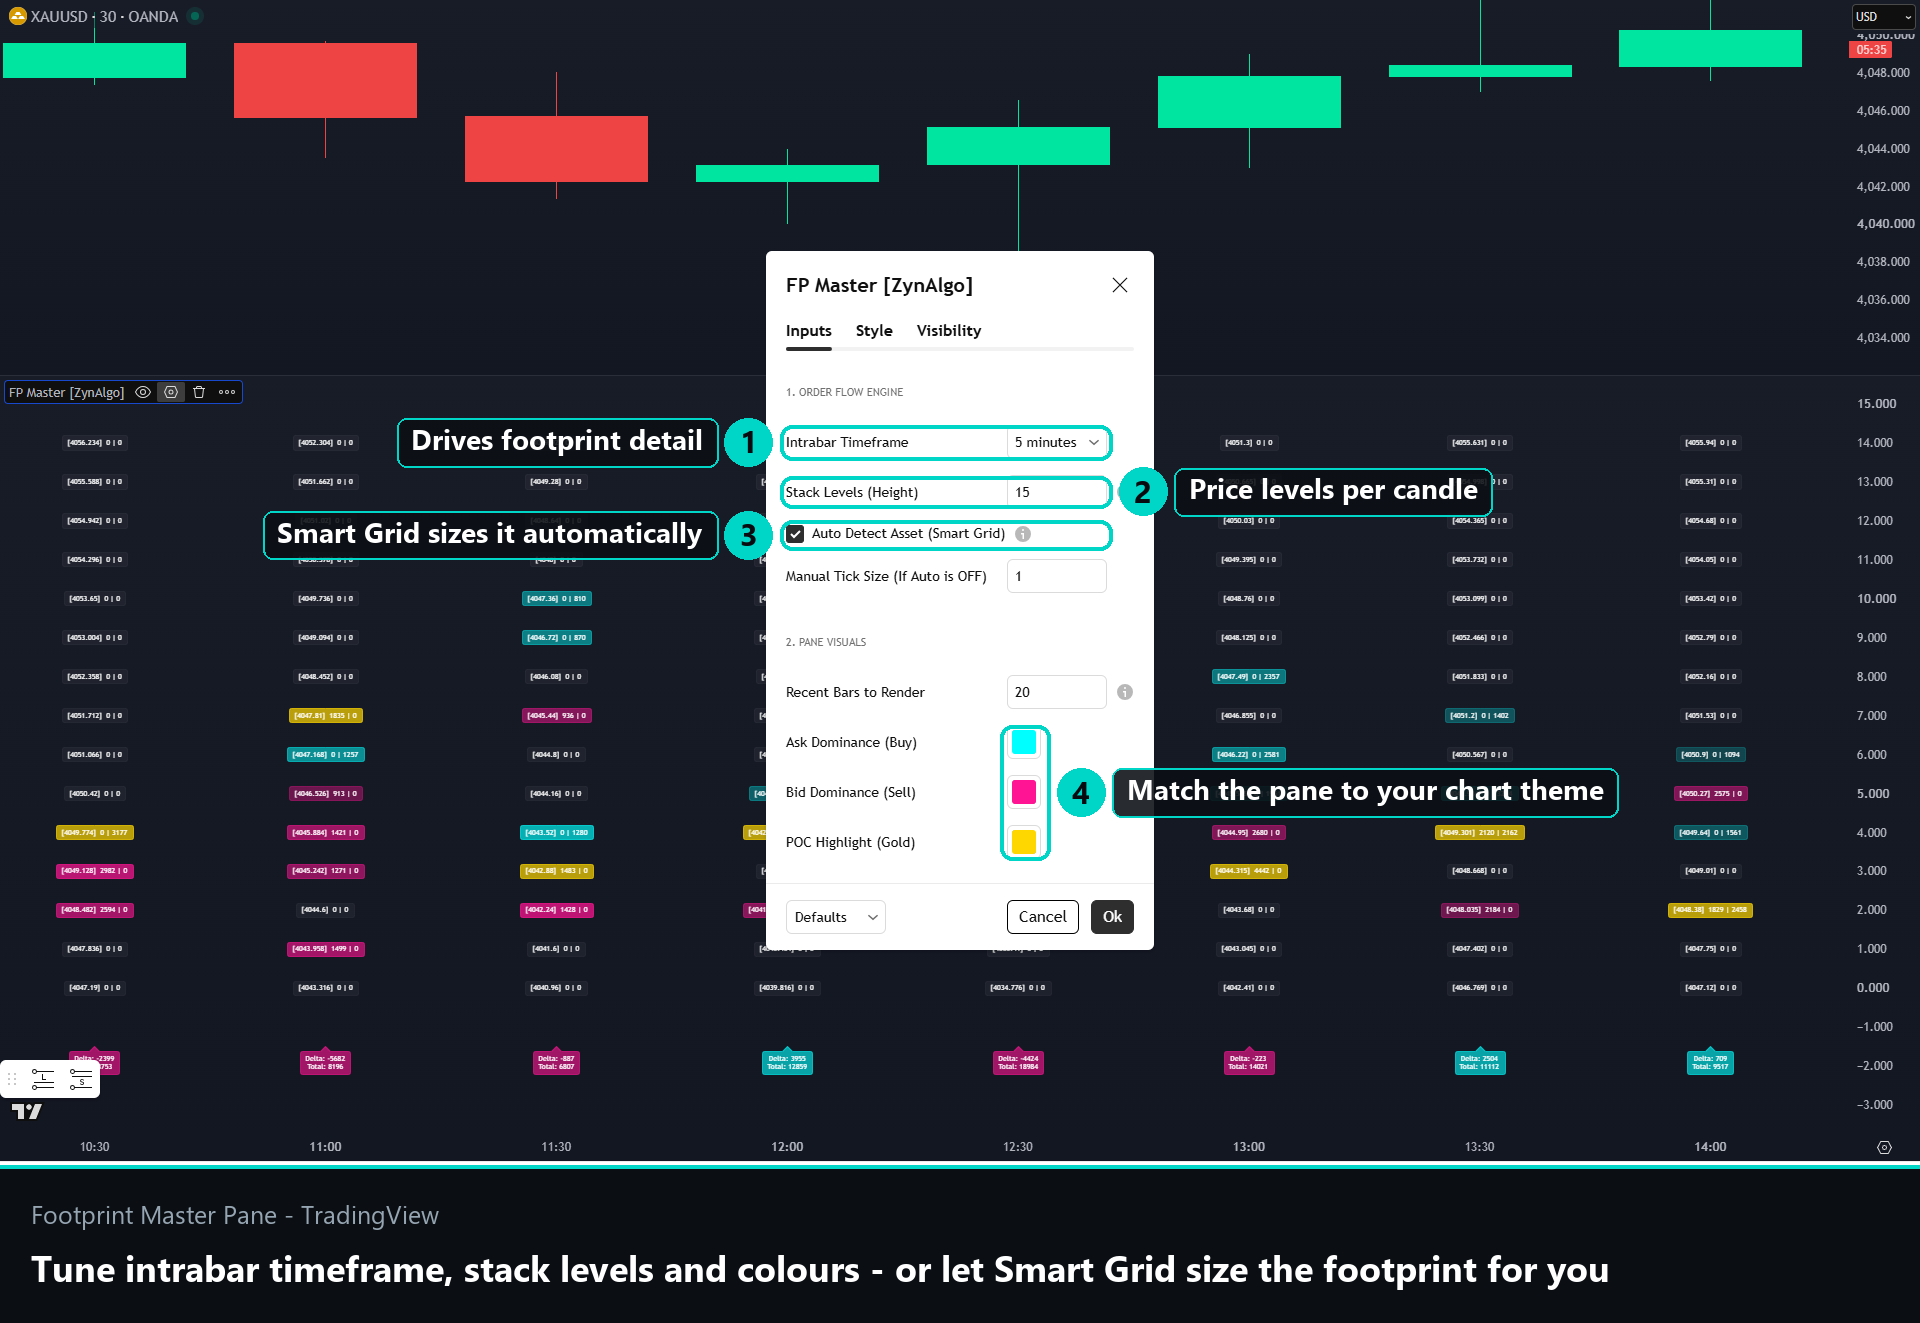
How the footprint column is defined
- Intrabar Timeframe - the lower timeframe supplying the raw candles, one minute by default.
- Stack Levels - how many price levels each column is divided into, fifteen by default.
- Auto Detect Asset - sizes the grid step from recent volatility, so the ladder stays usable when you change symbol.
- Manual Tick Size - used instead when Auto Detect is switched off.
- Recent Bars to Render - how many of the latest columns are drawn, ten by default, capped to protect chart performance.
How to read a footprint column
There are no entry signals to wait for here. The column itself is the information, and it answers three questions:
- Where did the bar do its work? The gold Point of Control is the level that absorbed the most volume. A Point of Control near the top of a down bar and near the bottom of an up bar are two very different bars.
- Which side was leaning? A run of cyan levels through the body says the buying estimate dominated across the range; a mix says neither side committed.
- How did it close out? The footer under each column prints Delta, the buying estimate minus the selling estimate, and Total, the volume behind the whole bar.
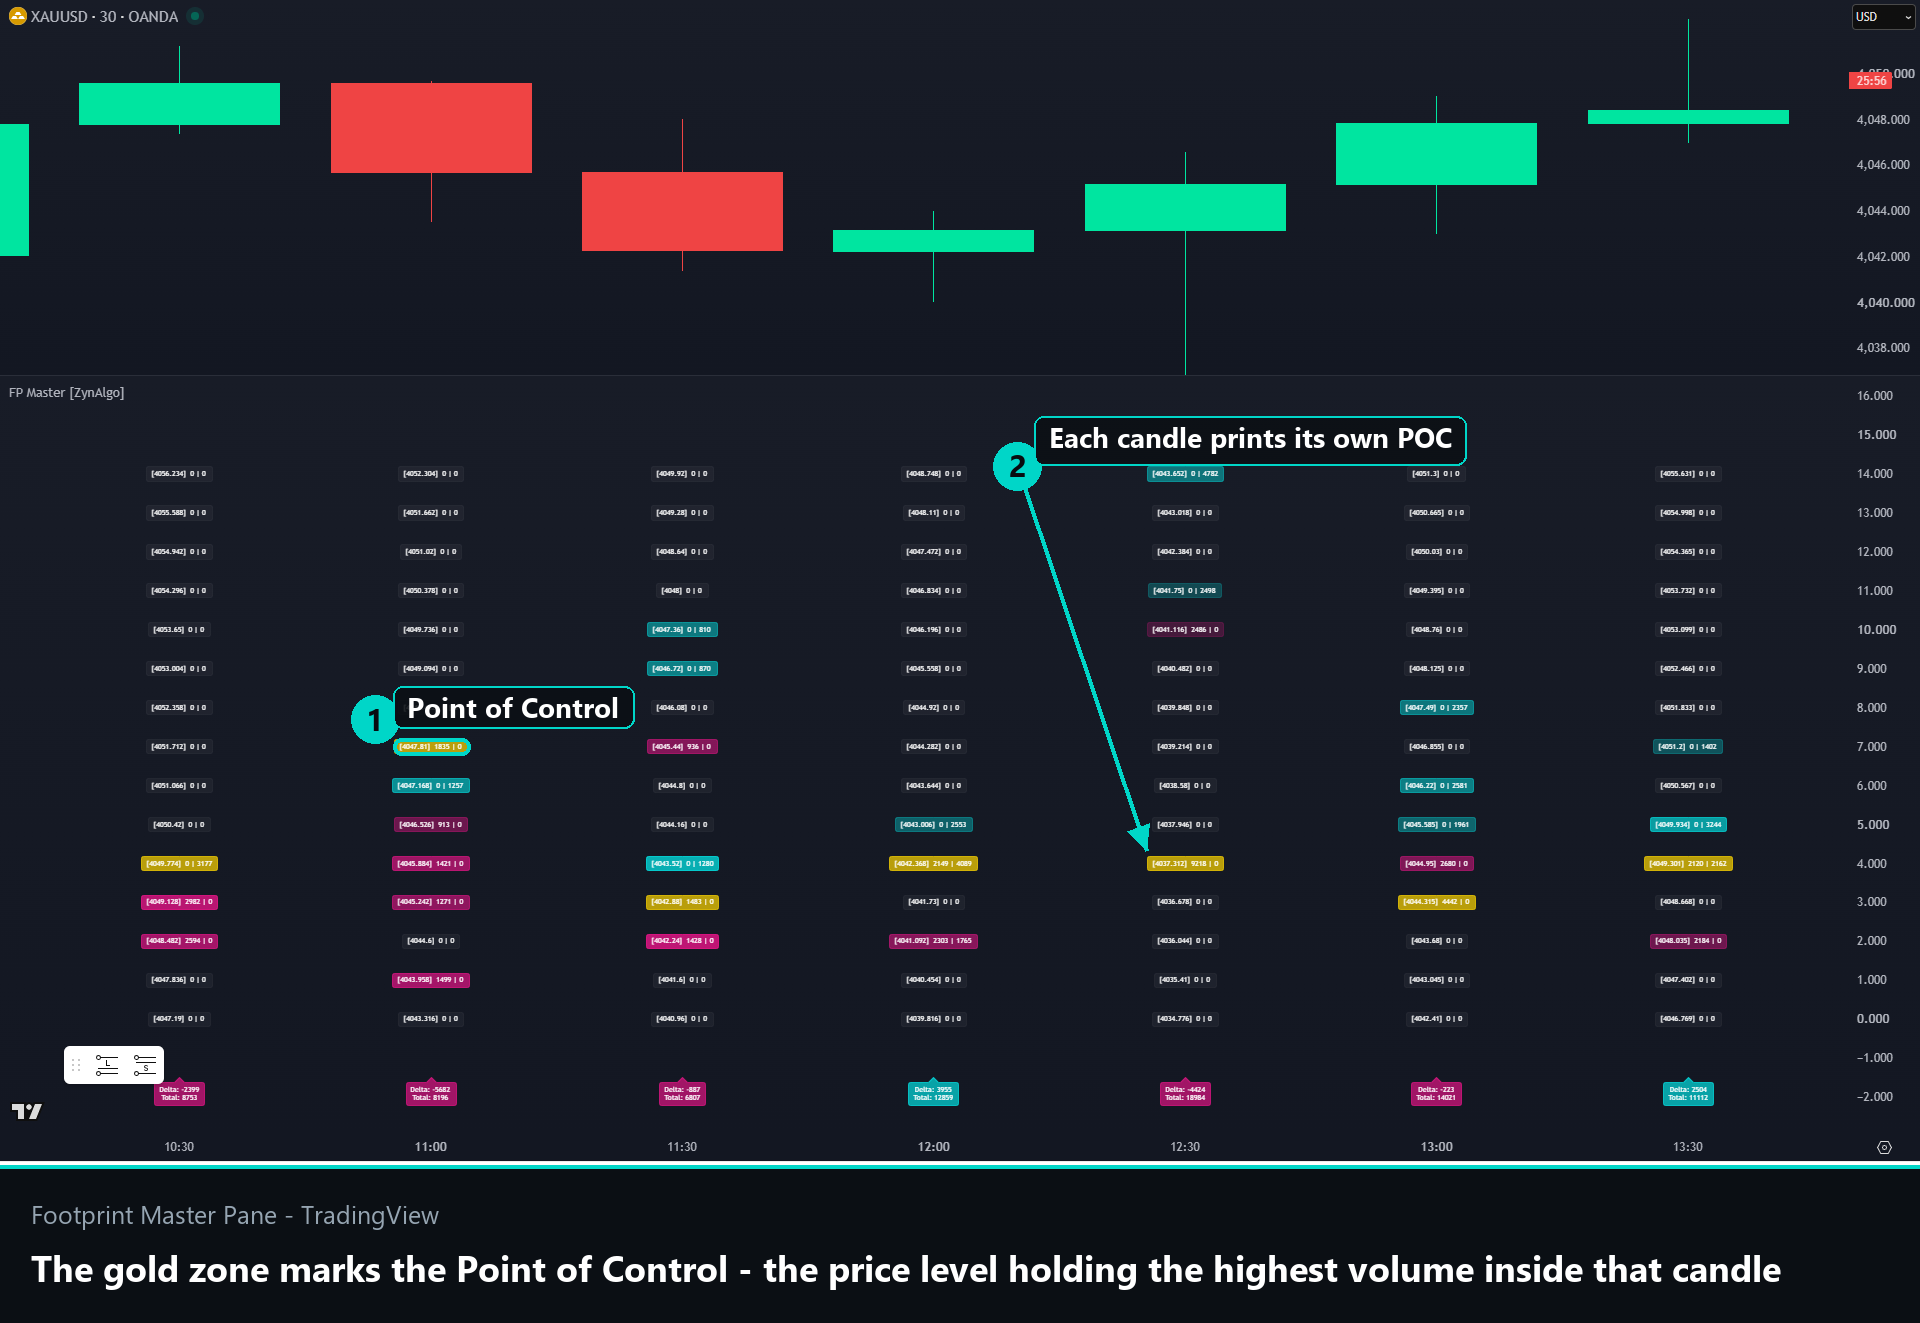
Delta and price direction do not have to agree, and the disagreements are usually the interesting ones. A bar that closes up on negative delta was pushed higher without the buying estimate to match, which is worth noting before you treat it as strength.
Only the most recent columns are drawn. That is a deliberate performance limit, not a fault - raise Recent Bars to Render if you need more history, and expect the chart to get heavier as you do.
Who this is built for
- Order-flow traders who want a footprint read without leaving TradingView.
- Volume and auction traders who work from where price traded rather than how fast it moved.
- Futures, crypto and liquid equity charts, where reported volume is meaningful. Spot FX has no central volume, so the columns will be far less useful there.
- Intraday timeframes. On high timeframes each bar contains too many intrabars for a fifteen-level ladder to say much.
This pane is a magnifying glass, not a trigger. It is at its best when you already have a level or an idea and want to see whether the volume inside the bar supports it.
Browse the full catalogue on the ZynAlgo marketplace.
No release notes have been published yet.





