
Divergence Wave
Most divergence tools compare price to a momentum line and stop there. Divergence Wave is built to ask a different question first: is the volume behind the move still there?
Key benefits
- Fewer false reads: an extreme-zone filter ignores divergences that form while the wave sits near zero.
- Visible evidence: every signal draws the two highs, or lows, it compared - on the price chart and inside the pane.
- Instant context: the wave colour, the bar colour and a compact dashboard all report the same reading.
How it works Divergence Wave splits each bar's volume into bullish and bearish participation, smooths both streams, and plots the balance as a single oscillator. When price prints a new extreme and the wave does not follow, the disagreement is marked. Full walkthrough is in the Manual.
What's included / Platforms TradingView version (public script, no access request needed). Free to add to your chart.
Best for Reversal and exhaustion traders on intraday to daily charts, using symbols that report real volume.
Get started Add Divergence Wave from the ZynAlgo marketplace and open it in a pane below your chart.
Disclaimer: trading involves risk; past performance does not guarantee future results.
Divergence Wave
What Divergence Wave measures - and what it ignores
Divergence Wave watches one thing: the balance of buying and selling volume behind a move, and whether that balance still agrees with price.
It measures participation rather than price speed. Each bar's volume is filed as bullish or bearish depending on whether the bar closed above or below its open, both streams are smoothed, and the difference is expressed as a share of total volume. What it deliberately ignores is the size of the candle - a wide bar on thin volume and a narrow bar on heavy volume are read very differently.
The result is a single oscillator on TradingView that tells you whether a new high or low is backed by real participation, or is being carried by momentum alone.
A note on the data: the split between buying and selling volume is estimated from each candle's direction. It is not exchange bid/ask data, and it should be read as a relative measure rather than a literal order-flow count.
The Role of the Delta Wave
The Delta Wave is the line you actually read. Above zero, buyers have controlled more of the recent volume; below zero, sellers have. The further it travels from zero, the more one-sided that participation has become.
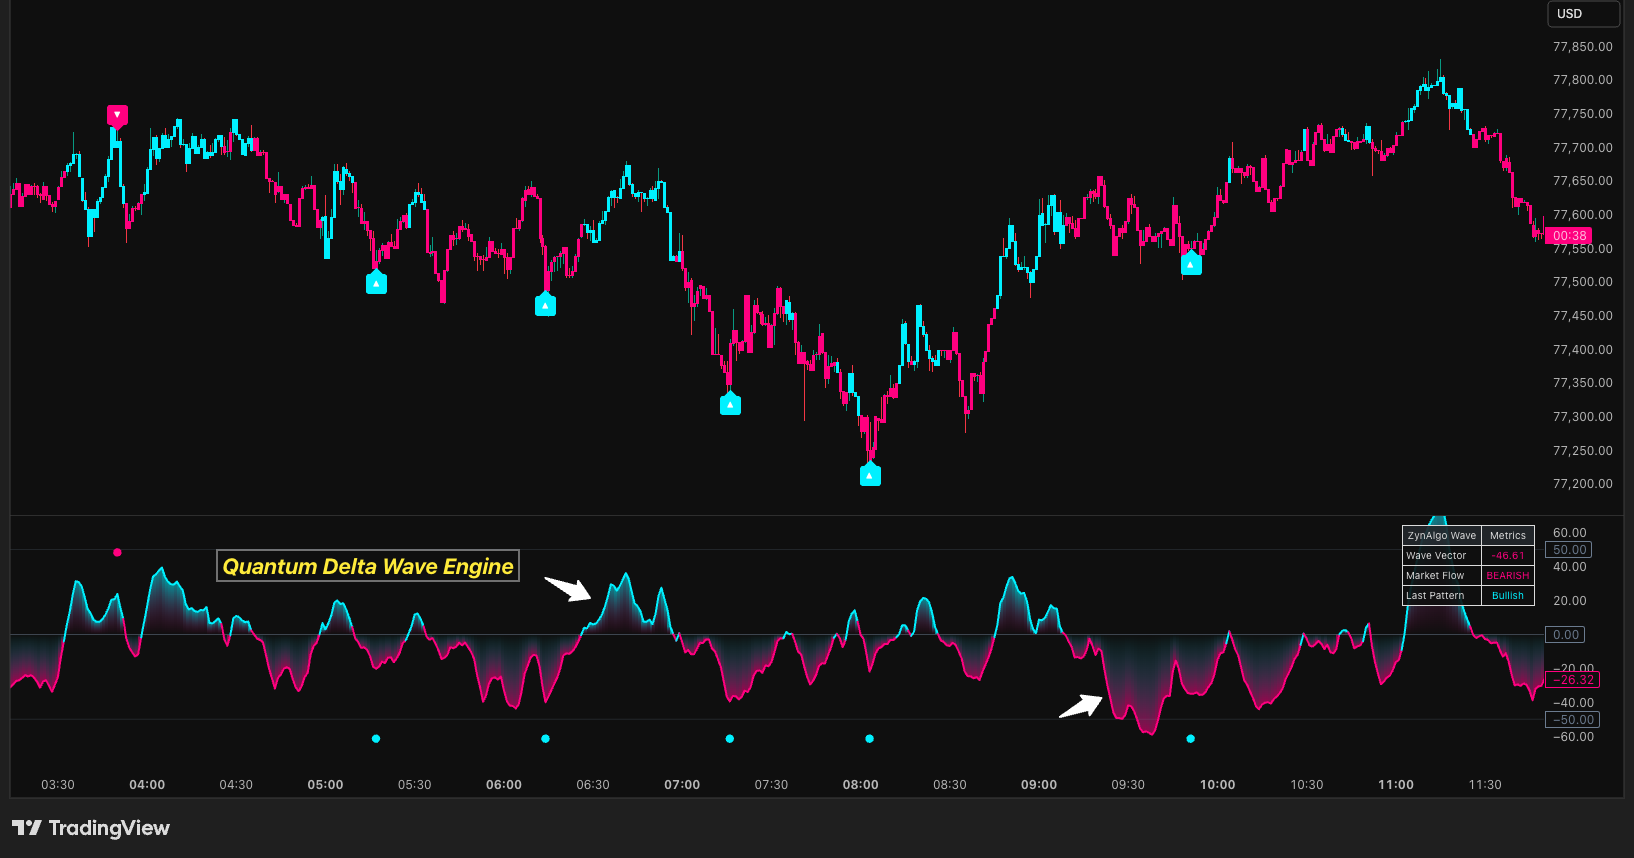
- A wave pushing further from zero alongside price: participation confirms the move.
- A wave flattening while price keeps going: the move is running on fewer participants.
- A wave crossing zero: control of recent volume has changed hands.
The common mistake is treating every turn in the wave as meaningful. Most turns happen near zero, where buying and selling are close to balanced and the reading says very little. That is exactly the noise the extreme-zone filter exists to remove.
How the Delta Wave is defined
- Bullish volume - the volume of every bar that closed above its open.
- Bearish volume - the volume of every bar that closed below its open.
- Delta Wave Lookback Range - the smoothing window applied to both streams before they are compared (default 20).
- Wave Smoothing Period - a final smoothing pass applied to the result (default 5).
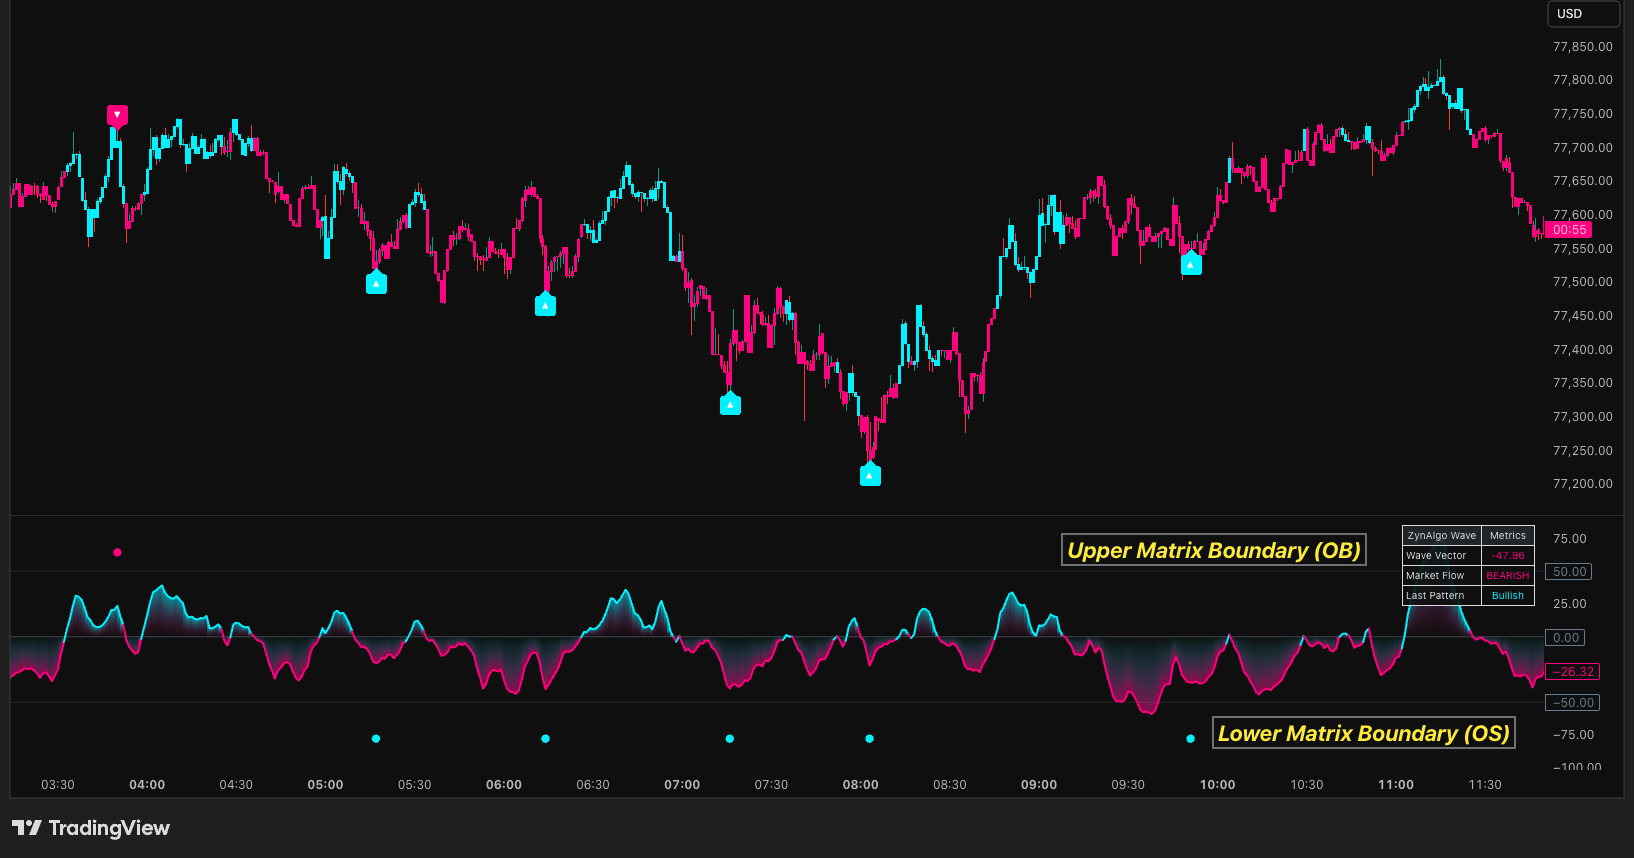
- Upper and Lower Matrix Boundary - the exhaustion levels, drawn at +25 and -25 by default.
- Extreme Zone Filter - when enabled, a wave turn only counts if it forms beyond 40% of the matching boundary.
How to trade with Divergence Wave
The indicator does not signal on the wave alone. It compares two turning points, and marks a divergence only when price and the wave disagree:
- Bullish divergence - price prints a lower low while the Delta Wave prints a higher low. A cyan marker is placed under the bar, and both pairs of points are joined by a line: one on the price chart, one inside the pane.
- Bearish divergence - price prints a higher high while the Delta Wave prints a lower high. A pink marker is placed above the bar, with the same pair of connecting lines.
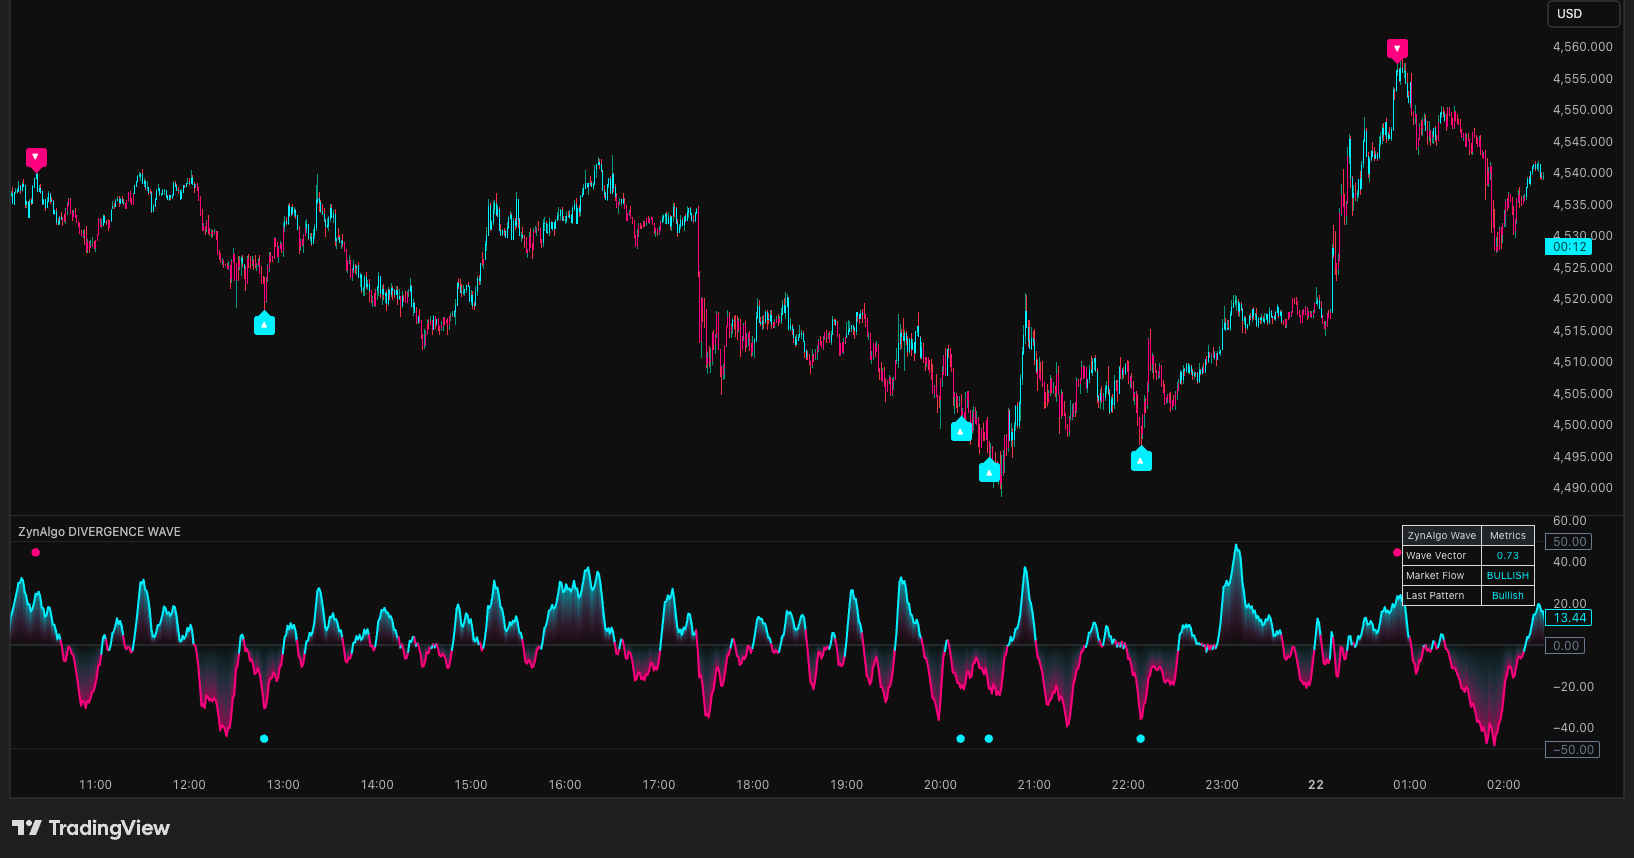
Two conditions must be met before a comparison is accepted. The two turning points have to be at least Minimum Pivot Bar Spacing apart, five bars by default, which stops adjacent wiggles from being read as structure. And with the Extreme Zone Filter on, the turn must have formed in the outer part of the range rather than around zero.
A turn in the wave can only be identified once the following bar has formed, so a marker is confirmed after the bar closes. Treat anything that appears mid-bar as provisional.
The dashboard in the corner repeats the same three readings: the current wave value, whether recent volume is net bullish or bearish, and which divergence was seen last.
Who should use Divergence Wave?
- Traders looking for exhaustion and reversal points rather than trend entries.
- Anyone trading symbols that report real volume - futures, crypto and liquid equities suit this better than spot FX.
- Intraday through daily charts; the defaults are tuned for a normal-speed chart rather than very fast timeframes.
A divergence is a warning that the crowd behind a move is thinning out, not an instruction to trade against the trend. It does its best work when you are deciding whether to trust a breakout or tighten an open position, alongside your own structure and risk rules.
Browse the full catalogue on the ZynAlgo marketplace.
No release notes have been published yet.





