Order Barrier
Built for traders who want a supply and demand indicator for NinjaTrader 8 that marks fewer levels without drawing another line by hand. ZynAlgo Order Barrier promotes a swing pivot to a zone only when the volume behind it was strongly one-sided.
Key benefits
- Fewer, better levels - a pivot becomes a barrier only when directional volume clears an adaptive threshold.
- Zones that fit the market - box thickness follows long-term ATR, widening with volatility and tightening when it fades.
- Break and role-swap tracking - broken barriers flip colour and turn dashed; C-UP and C-DN labels mark the first clean clearance.
- Volume you can read - every box prints the net delta volume that created it.
How it works
Each confirmed pivot is tested against a delta-volume reading built from candle direction and volume. Pivots that clear the threshold become an ATR-sized box, and every later touch is classified as a defence or a clearance. It maps context and structure - it does not issue buy or sell entries. Full walkthrough in the Manual.
What's included / Platforms
- NinjaTrader 8 indicator (NinjaScript), delivered for installation in NinjaTrader 8 once access is granted. Released to ZynAlgo VIP members.
Best for
Intraday and swing traders on volume-bearing markets - futures, indices, crypto - trading supply and demand, break-and-retest or role-reversal setups.
Get started
Browse the ZynAlgo marketplace
Disclaimer: an analysis tool, not financial advice or a signal service. No indicator removes market risk - trade with your own plan and risk management.
Order Barrier
Reading the market through volume-validated order barriers
ZynAlgo Order Barrier does one thing: it marks the price areas where a confirmed swing pivot happened at the same moment as an unusually one-sided burst of volume, then follows how price behaves every time it comes back to those areas. It is a mapping and context tool - not an entry-signal generator.
To build that map, the indicator works with:
- confirmed pivot highs and pivot lows over a user-set scan period,
- a per-bar directional (delta) volume reading derived from candle direction and volume,
- an adaptive volume threshold that decides which pivots deserve a zone,
- long-term ATR, which sizes the thickness of each zone,
- and the interaction between price and the edges of every zone already on the chart.
The result on NinjaTrader 8 is a chart carrying a small number of volume-backed supply and demand zones instead of dozens of hand-drawn lines - plus a running visual record of which of those zones is still being defended and which has already given way.
Inside ZynAlgo Order Barrier: the volume-validated barrier zone
The core concept is the Order Barrier: a swing pivot that is promoted to a zone only when the volume printed at that pivot was strongly one-sided. A pivot on its own only tells you that price turned. A pivot with heavy directional volume behind it tells you the turn cost somebody real money - and those are the levels price tends to react to again.
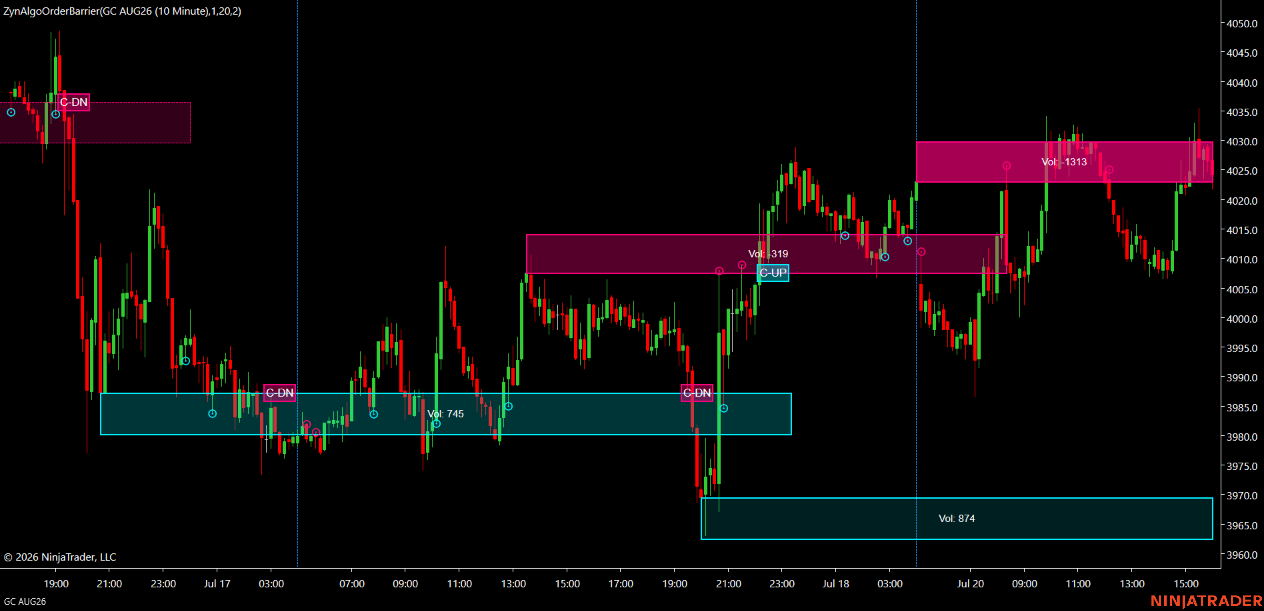
What a valid Order Barrier looks like on the chart:
- a cyan box hanging BELOW a swing low - demand, built when that bar carried strong positive delta volume;
- a pink box sitting ABOVE a swing high - supply, built when that bar carried strong negative delta volume;
- a fill whose intensity scales with how large that delta volume was compared with the last 25 bars;
- a "Vol:" readout printed inside every box, showing the exact net delta volume that created it;
- a zone, not a line - the box always has thickness.
Common mistake: treating every swing high and low as equal. Most levels on a chart are simply where price paused; with no participation behind them there is nothing to defend them on the retest. The volume filter exists to leave those out - which also means a quiet range may produce very few boxes. That is the filter working, not a fault.
How the Order Barrier is defined
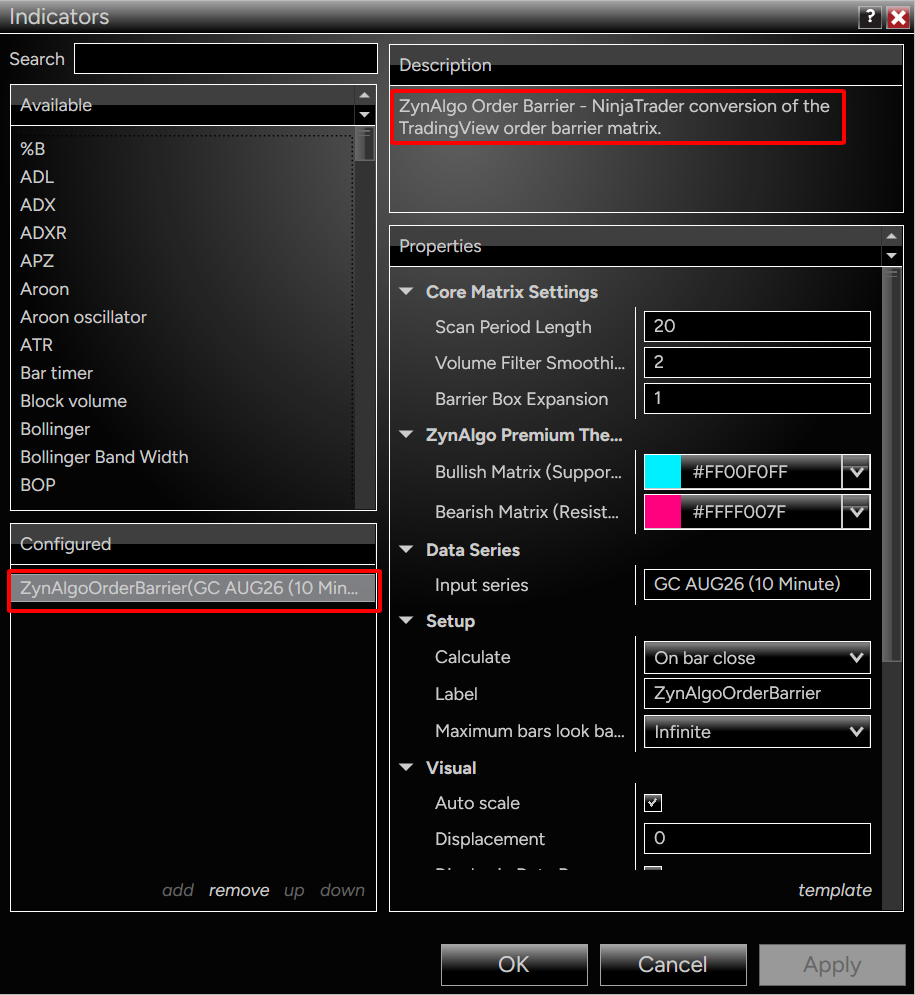
- Pivot detection (Scan Period Length) - locates the swing high or swing low that anchors the barrier. A pivot is only confirmed after the same number of bars has passed to its right, so a barrier is always drawn back at the pivot bar, never on the live bar.
- Delta volume reading - each bar contributes +volume when it closes above its open and -volume when it closes below. This directional participation measure is what the whole filter is built on.
- Adaptive volume threshold (Volume Filter Smoothing) - the delta reading is scaled down and tracked over a short window; a demand barrier requires the current delta to sit above the recent high of that band, a supply barrier requires it to sit below the recent low. Raising the value makes the band harder to clear, so fewer and more selective barriers appear.
- ATR(200) x Barrier Box Expansion - sets how far the box extends away from the pivot price - downward from a pivot low, upward from a pivot high. Being ATR-based, zones widen automatically in volatile conditions and tighten in quiet ones.
- Gradient fill - the background is graded by delta volume relative to the strongest reading of the last 25 bars, so a heavier barrier also looks visually heavier.
- Neon colour pair - cyan for the bullish / demand side, pink for the bearish / supply side. Both colours are editable in the settings.
- Right-edge extension - every active box keeps stretching to the current bar, so an old barrier stays live and testable instead of expiring.
- Box budget - the chart holds up to 50 barrier boxes; the oldest drop off as new ones form.
When trading opportunities appear
ZynAlgo Order Barrier does not print BUY or SELL entries. There is no entry arrow, no long/short call, and no stop or target logic inside the tool. What it prints is four interaction states that describe how price treated a barrier - the entry decision and the risk plan stay with you.
The four states, exactly as the tool computes them:
- Floor defence - cyan symbol below the bar - the bar's low crosses back up through the pivot price of a demand barrier: the zone was tested and held.
- Ceiling defence - pink symbol above the bar - the bar's high crosses back down through the pivot price of a supply barrier: the zone rejected price.
- C-UP label (cyan, at the supply pivot) - the bar's low clears above the OUTER edge of a supply barrier for the first time - price is not merely poking into supply, the whole bar range is above it. Read it as: this ceiling has been taken out.
- C-DN label (pink, at the demand pivot) - the bar's high drops below the OUTER edge of a demand barrier for the first time - the floor has been lost.
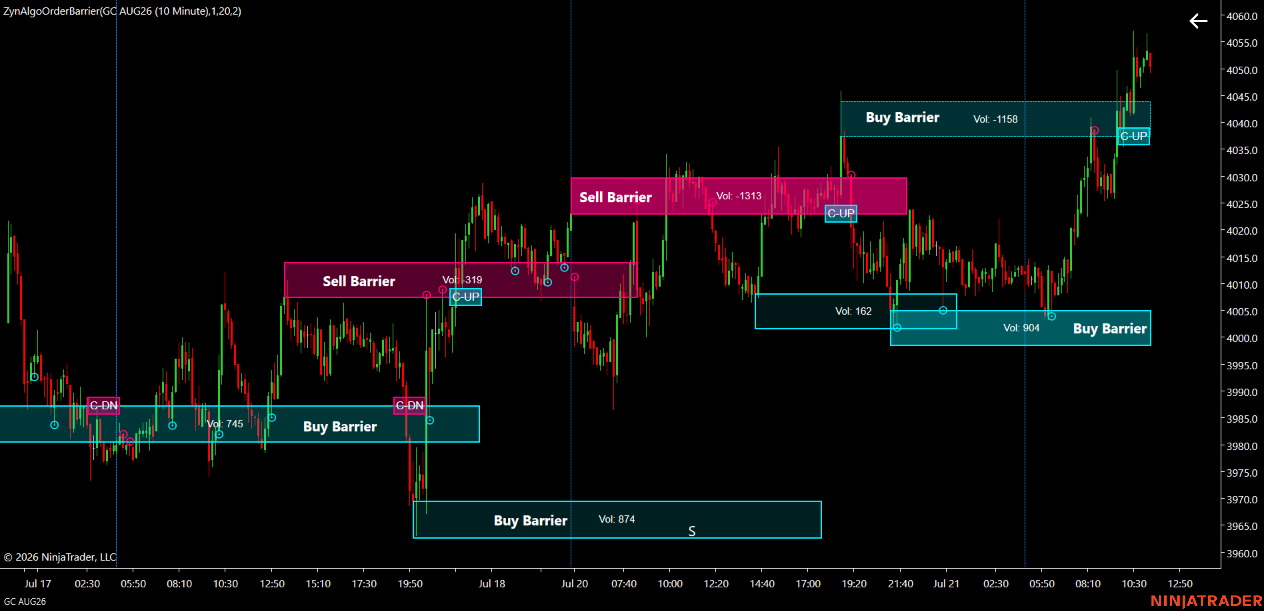
After a break the barrier does not disappear - it changes state, and that is where the role-reversal reading comes from:
- a broken zone flips to the opposite colour and to a DASHED border, marking it as already taken out;
- if price later returns and defends it, the zone goes back to a SOLID border and its original fill;
- while a zone is still in the broken state, a further clearance in the same direction prints another symbol marker - cyan below the bar after an upside clearance, pink above the bar after a downside one - flagging an old ceiling now acting as a floor, or an old floor now acting as a ceiling.
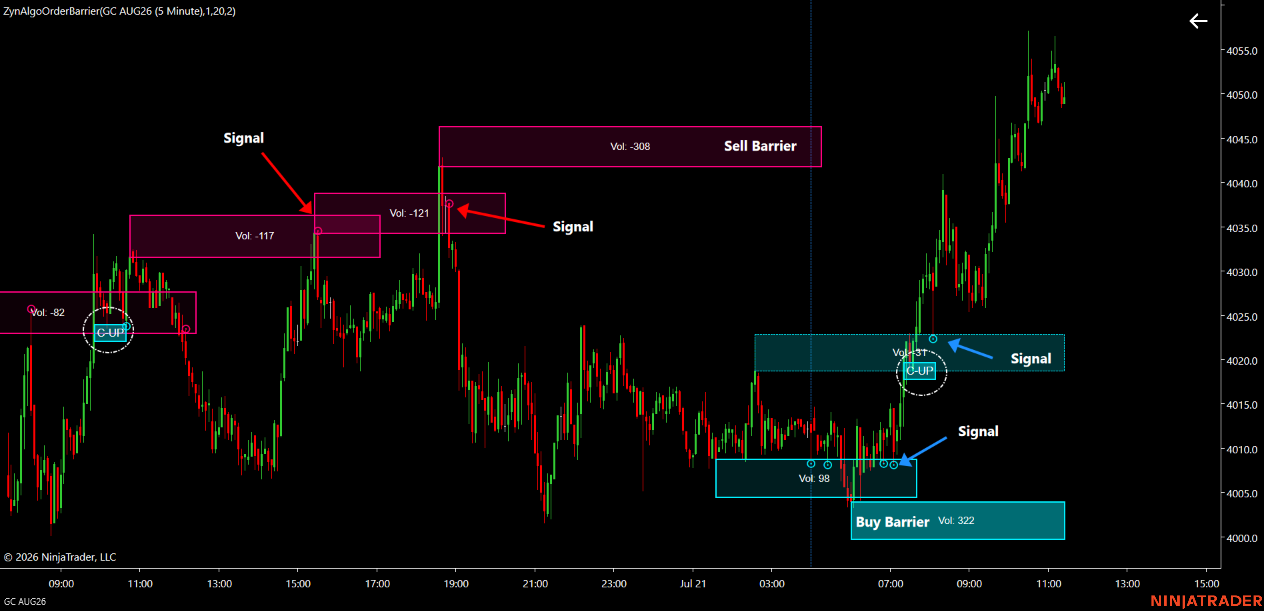
Market conditions worth reading alongside those states:
- repeated defence markers on the same zone - participation is still being spent defending it;
- a C-UP or C-DN on a box whose fill is barely tinted - the barrier that just broke was a light one;
- price drifting between two barriers with no markers at all - nothing is being decided, so there is no context edge;
- a break followed shortly by a defence marker on the same zone from the other side - the break-and-retest transition this tool was built to make visible.
The labels are deliberately short: C-UP means a clearance upward through supply, C-DN means a clearance downward through demand. Nothing more is implied about the direction of the next move.
Best suited for
- Supply & demand and support/resistance traders - you want the levels filtered by participation rather than drawn by eye.
- Intraday and swing traders on volume-bearing markets - futures, indices and crypto. On spot FX the feed is tick volume, so treat the filter as a rough proxy there.
- Break-and-retest / role-reversal playbooks - you need one consistent, mechanical definition of "broken" and "defended" instead of a judgement call.
- Traders who already own an entry trigger - Order Barrier supplies context, not a system to follow blindly.
A barrier is a reaction area, never a promise. The value is in knowing which levels the market has actually paid to defend, then working fewer and better-located ideas around them with your own risk management in place.
Browse the ZynAlgo marketplace
Risk note: ZynAlgo Order Barrier is an analysis tool. It does not place trades, it cannot know what price will do next, and no indicator removes market risk. Always trade with your own plan and position sizing.
- Order Barrier v1Jul 21, 2026
Initial release
Why My Support and Resistance Levels Keep Getting Run Through
You draw levels at every pivot, yet most get blown through with no reaction. Order Barrier filters support and resistance zones by the volume that formed them, so you work with the ones traders actually defended.
Why My Support and Resistance Levels Keep Failing to Hold on Retest
You mark every swing high and low, but half of them collapse the moment price comes back. Learn how volume-validated barriers filter out the weak levels and track which zones the market actually defends.