Dynamic Trail Breakout Pro [ZynAlgo]
Built for traders who want to join a trend they already missed, without buying the top of it. Dynamic Trail Breakout Pro waits for the pullback, then checks whether volume came back before marking the re-entry.
Key benefits
- Two-line structure: a structural trail for the trend, a fast trail for the pullback boundary.
- Volume-confirmed entries: a reclaim without participation behind it produces nothing.
- Clean charts: the pullback zone only appears when a pullback is actually happening.
How it works It tracks the trend with a wide trailing line, declares a pullback when a tighter line disagrees with it, then marks the bar where price reclaims the tight line on above-average volume. The full walkthrough is in the Manual.
What's included / Platforms NinjaTrader 8 indicator, lifetime or membership access.
Best for Trend traders on M5 to H4 charts in actively trending markets such as gold, oil and major currency pairs.
Get started See it on zynassets.com/marketplace.
Disclaimer: Trading involves risk. Markers are analytical re-entry events and do not guarantee future results.
Dynamic Trail Breakout Pro [ZynAlgo]
Dynamic Trail Breakout Pro at a glance
The hardest part of trend trading is not finding the trend. It is deciding where to get in once you have missed the first move, without buying the exact spot where the trend ends.
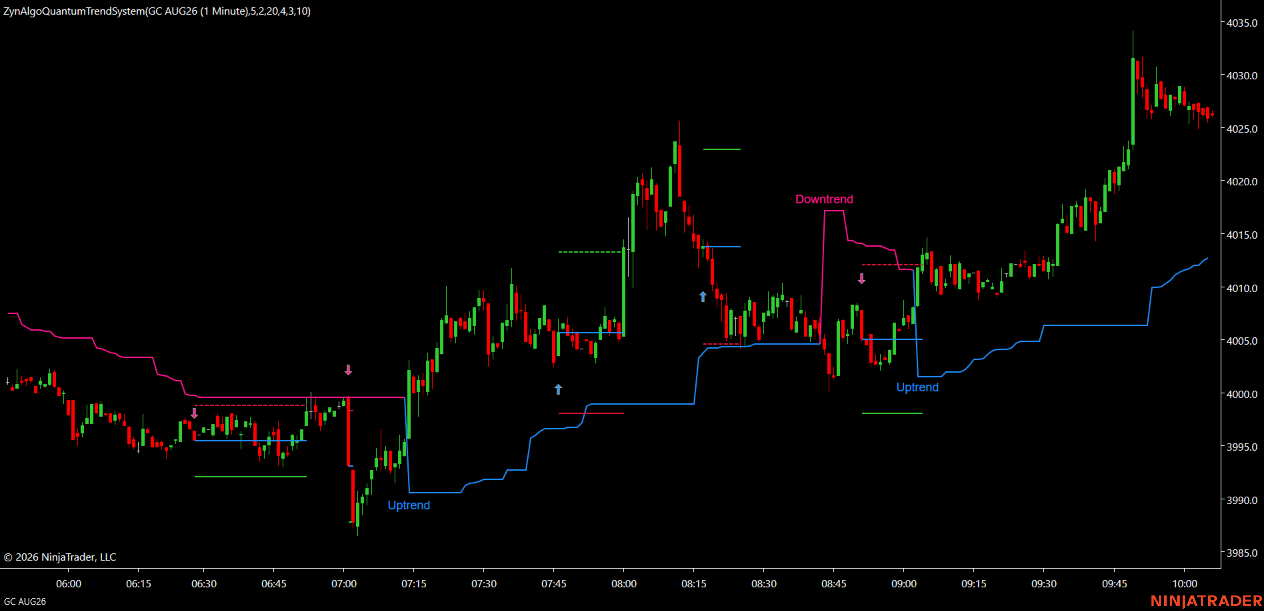
This tool answers that with two trailing lines instead of one. A slow line defines the trend and acts as the structural boundary. A fast line sits closer to price and defines the short-term boundary that a pullback breaks and then has to reclaim.
The space between them is the working area. When price is running cleanly with the trend, the fast line and that space are hidden entirely, so the chart shows nothing but the trend line. They only appear when a pullback is actually happening, on NinjaTrader 8.
How Dynamic Trail Breakout Pro reads a pullback
A pullback and a trend reversal look identical while they are happening. The difference only becomes clear afterwards, which is why most traders either exit too early or hold too long.
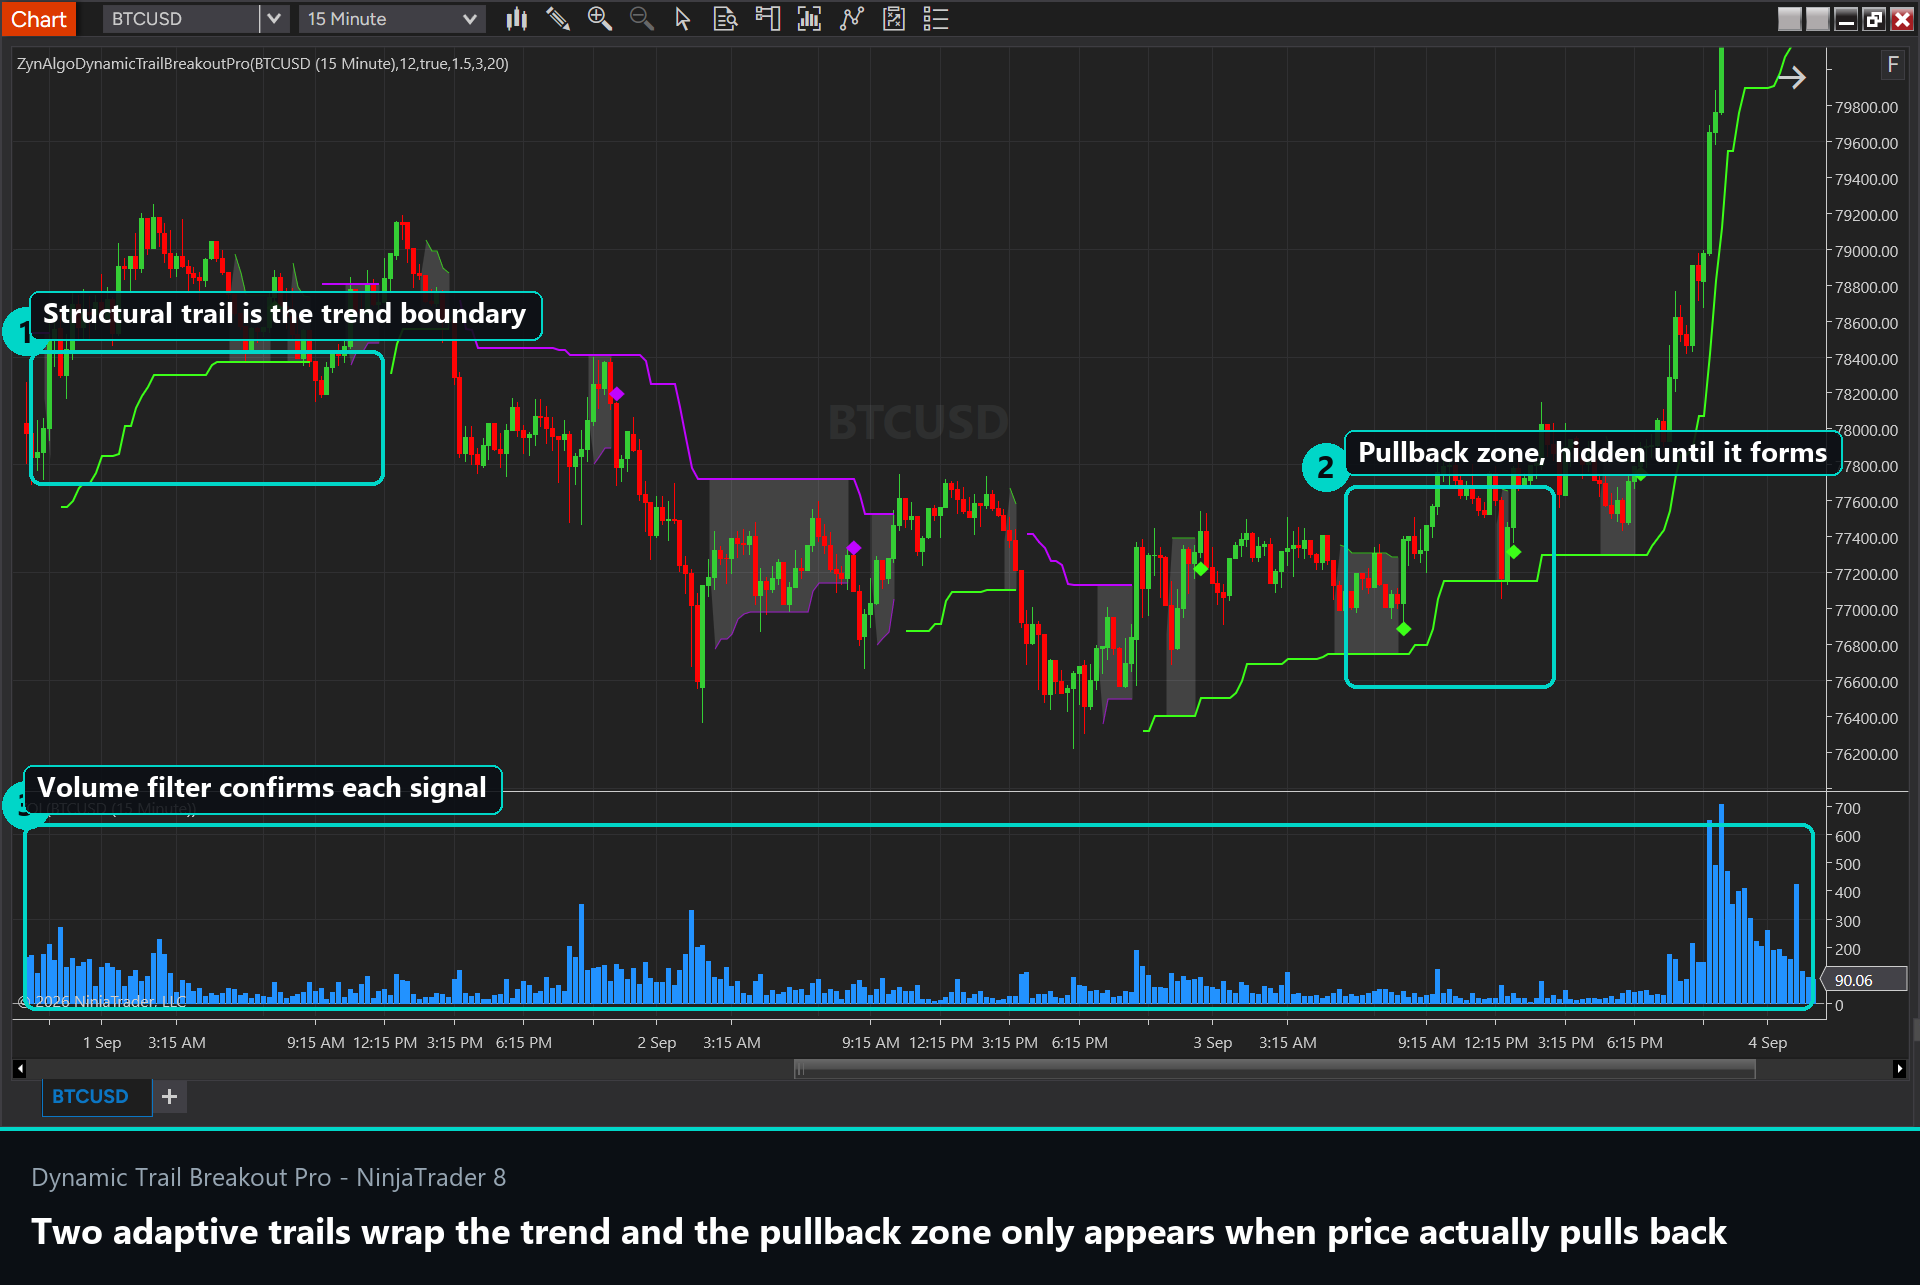
- The thick trail is the structural line. As long as price has not closed beyond it, the trend is intact by definition.
- Most of the time that is the only thing on the chart, because there is nothing else worth showing.
- The common mistake during a pullback is reacting to the first sign of weakness. The tool is built so that weakness inside the working area does not count as anything at all.
How the pullback zone is defined
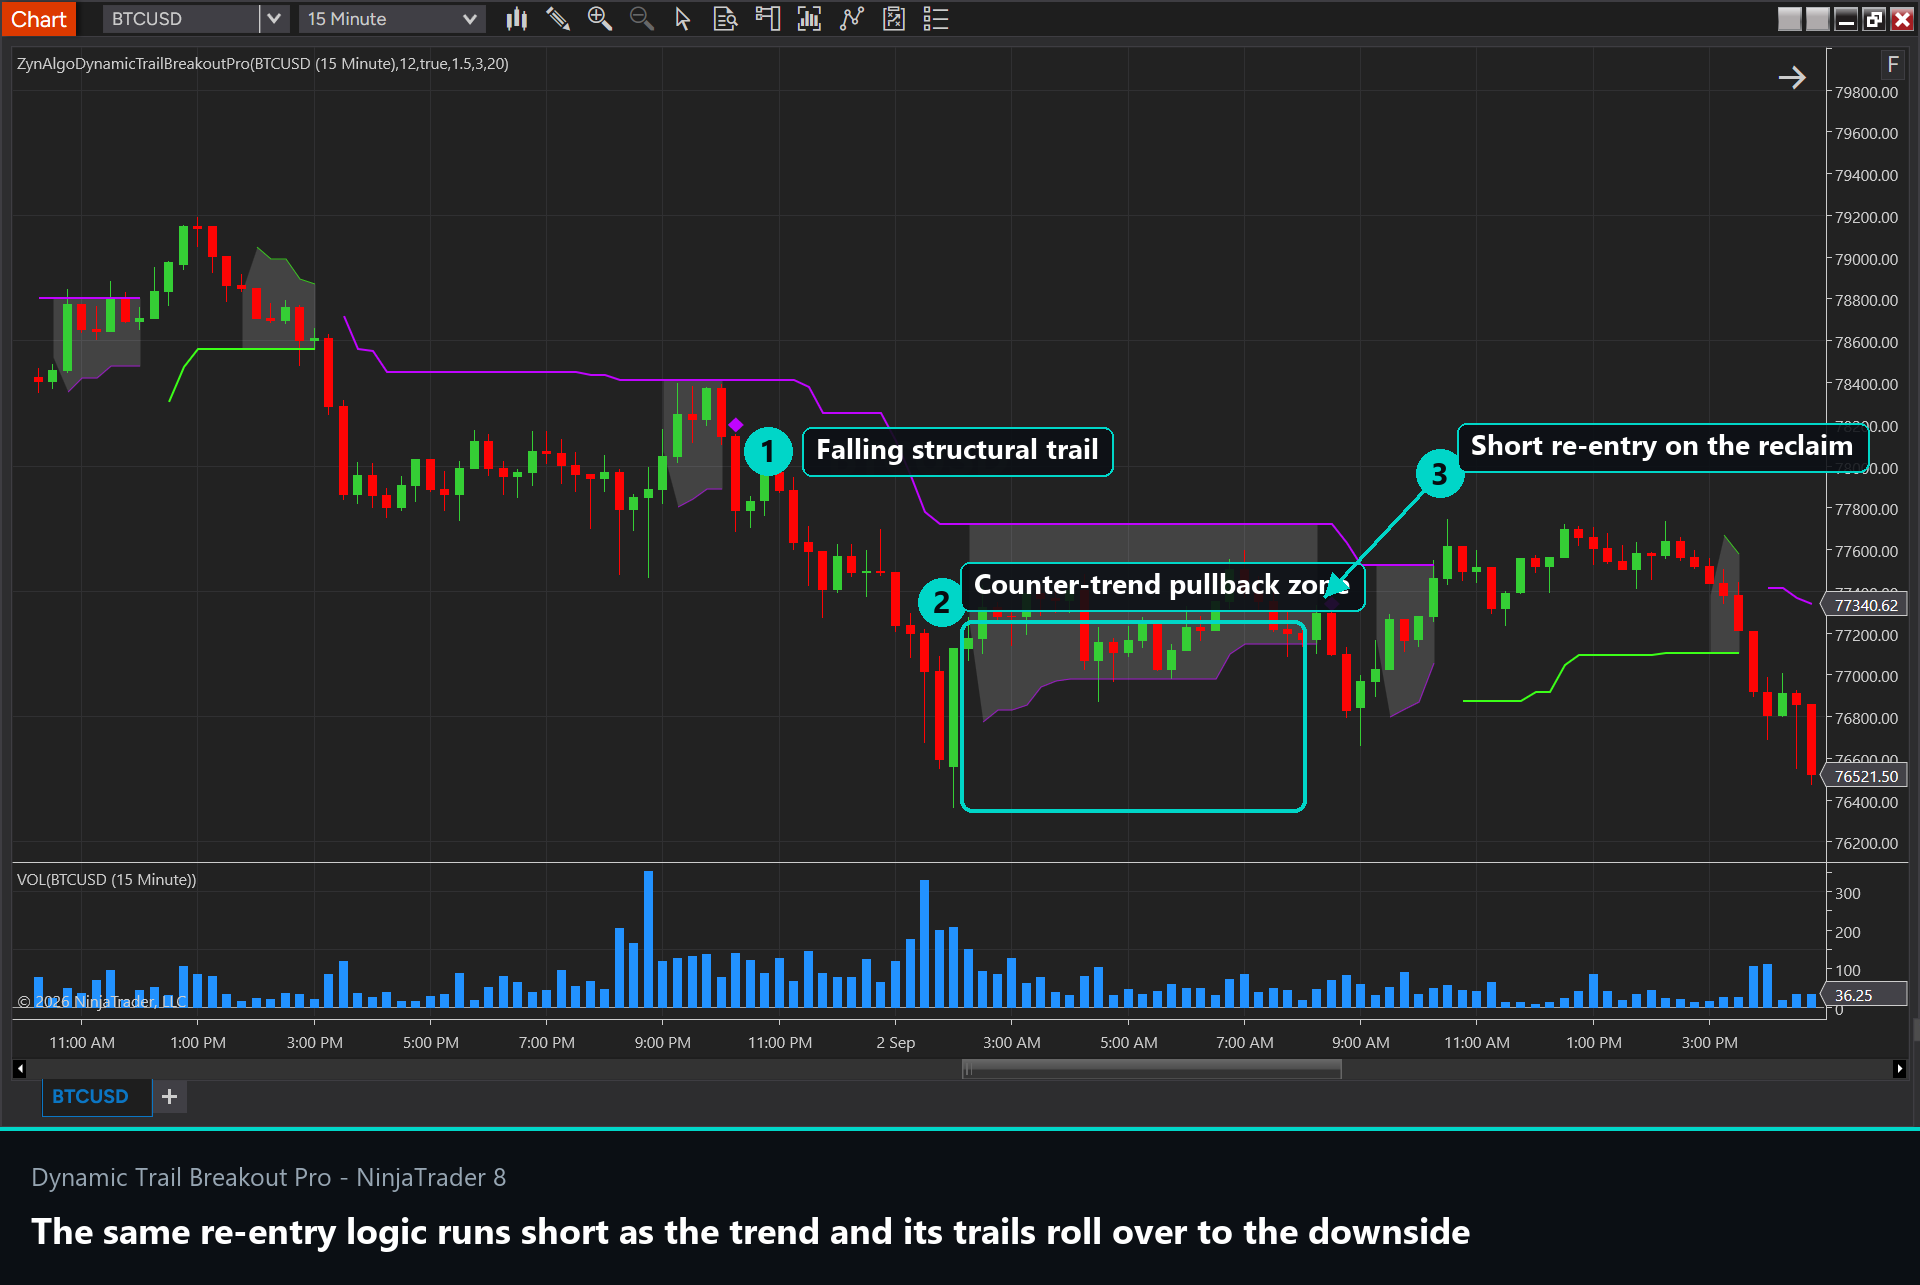
- The two trails are calculated from the same volatility measure with different multipliers: a tight one for the fast line, a wide one for the structural line.
- A pullback is declared when the two disagree, meaning the structural line still reads bullish while the fast line has flipped bearish. That disagreement is what paints the zone.
- The zone is the discount area of the current wave: price has retraced, but it has not broken anything that matters.
- Widening the fast multiplier makes the zone deeper, which means price has to retrace further before the tool will consider a re-entry.
When trading opportunities appear
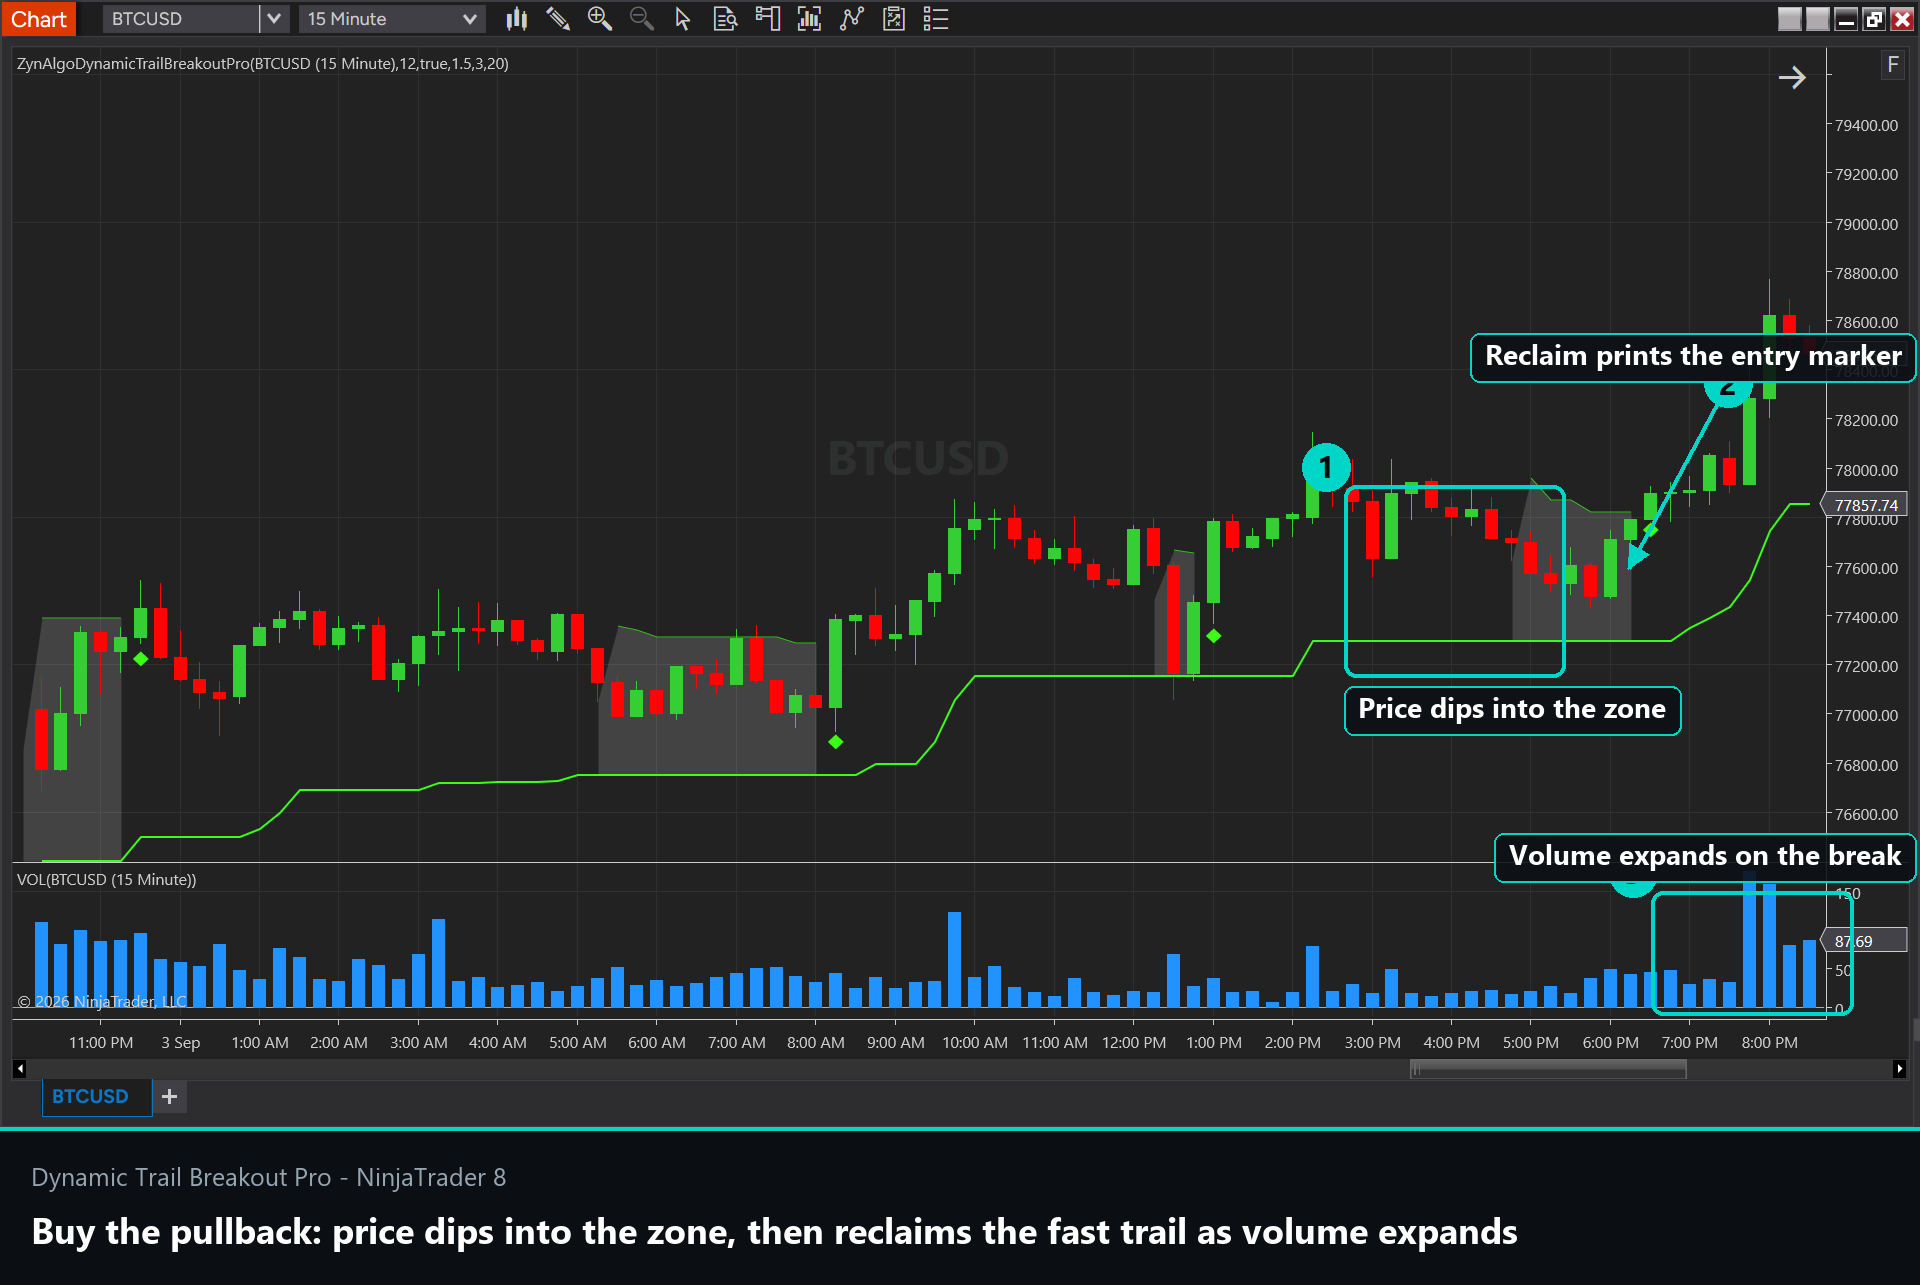
The scenario runs in three steps, and all three must complete:
- Trend holds. Price respects the structural line and does not close beyond it.
- The dip. Price breaks the fast line and moves into the zone. This is the part that shakes out traders who set stops too close.
- The rip. Price reverses and closes decisively back across the fast line, and the volume on that bar is above its recent average. The marker prints on that bar.
The volume requirement is the anti-fakeout filter, and it is the reason a technically clean reclaim sometimes produces no marker. If participation did not come back with price, the tool treats the reclaim as unconvincing.
For risk, the structural line is the reference: place the stop beyond it rather than beyond the entry bar, and trail it along that line as the trend extends. The line moving up under price is the trend management plan, not just a signal input.
This works best in markets that are genuinely trending with active volatility. In a tight range the two trails cross constantly, and while the volume filter removes many of the resulting markers, it cannot remove all of them.
Is Dynamic Trail Breakout Pro right for you?
- Trend traders who want to add on pullbacks rather than at the start of a move.
- Traders who need a mechanical way to distinguish a shakeout from a real structural break.
- Anyone who wants a clean chart most of the time, with detail appearing only when there is something to decide.
The trend line keeps you in. The zone tells you where a pullback is still healthy. The volume on the reclaim tells you whether anyone came back.
Browse the full ZynAlgo catalogue at zynassets.com/marketplace.
Trading involves risk. Trails, zones and markers are analytical references only, and volume filters can still allow false breaks in unstable conditions.
- Dynamic Trail Breakout Pro [ZynAlgo] v1Jul 17, 2026
Initial release