S&R Pro
A market-structure tool that focuses on where liquidity actually rests, not noise. ZynAlgo S&R Pro is a liquidity indicator for NinjaTrader 8 that marks every confirmed swing high and swing low, then draws the pool of resting orders sitting just beyond it.
Key benefits
- Levels you did not have to draw - swings are detected from closed bars, so your key levels stay objective.
- The two levels that matter, always visible - the newest buy-side and sell-side lines extend to the current bar.
- Fewer chased breakouts - reading a break as a liquidity raid changes how you react to it.
- Alerts instead of screen time - four alerts cover new swings and price reaching either liquidity side.
- A chart that stays readable - adjustable line width, style and colours, plus optional candle colouring.
How it works
Pivot highs and lows over an adjustable left/right window define each swing. The pivot bar's price becomes a liquidity line running right until the next same-type swing is confirmed. Full logic and chart examples are in the Manual.
What's included
NinjaTrader 8 indicator access (NinjaScript, overlay), configurable pivot depth, liquidity line styling, candle colouring options, and four alert conditions.
Best for
Traders working with market structure, liquidity and smart-money concepts, on any market and timeframe NinjaTrader 8 supports - tune the pivot depth to fit.
Get started
Add ZynAlgo S&R Pro to your chart and see where the liquidity really is. Trading involves risk; this indicator is an analysis tool, not a guarantee of results.
S&R Pro
Platform: NinjaTrader 8 (NinjaScript) - Type: indicator (overlay). This tool maps structure and liquidity - it does not produce entry signals.
Understanding ZynAlgo S&R Pro
ZynAlgo S&R Pro is a market-structure overlay for NinjaTrader 8. Instead of trying to tell you when to buy or sell, it does one job well: it marks the swing highs and swing lows that price has actually confirmed, and it draws a liquidity line at each of them so you always know where the nearest pool of resting orders sits.
Everything on the chart comes from a small, transparent set of calculations:
- Pivot highs and pivot lows over a symmetric left/right bar window (default 20 bars each side).
- The high of a confirmed pivot bar becomes the last swing high; the low of a confirmed pivot bar becomes the last swing low.
- A liquidity line drawn at each confirmed swing, starting at the real pivot bar and extending to the right.
- Four alert conditions: a new swing high, a new swing low, and price reaching either liquidity side.
- An optional candle colouring layer based on the current close versus the previous close.
Put together, you get a clean, objective map of where liquidity is parked above and below price on NinjaTrader 8, without the indicator making the trading decision for you.
Liquidity pools explained
Price rarely travels to a random destination. It travels toward areas where orders are resting. Above a swing high sit the protective stops of sellers and the breakout orders of buyers, which is why that area is called buy-side liquidity. Below a swing low sit the stops of buyers and the breakout orders of sellers, which is sell-side liquidity. ZynAlgo S&R Pro draws those two areas for you and keeps them updated as structure evolves.
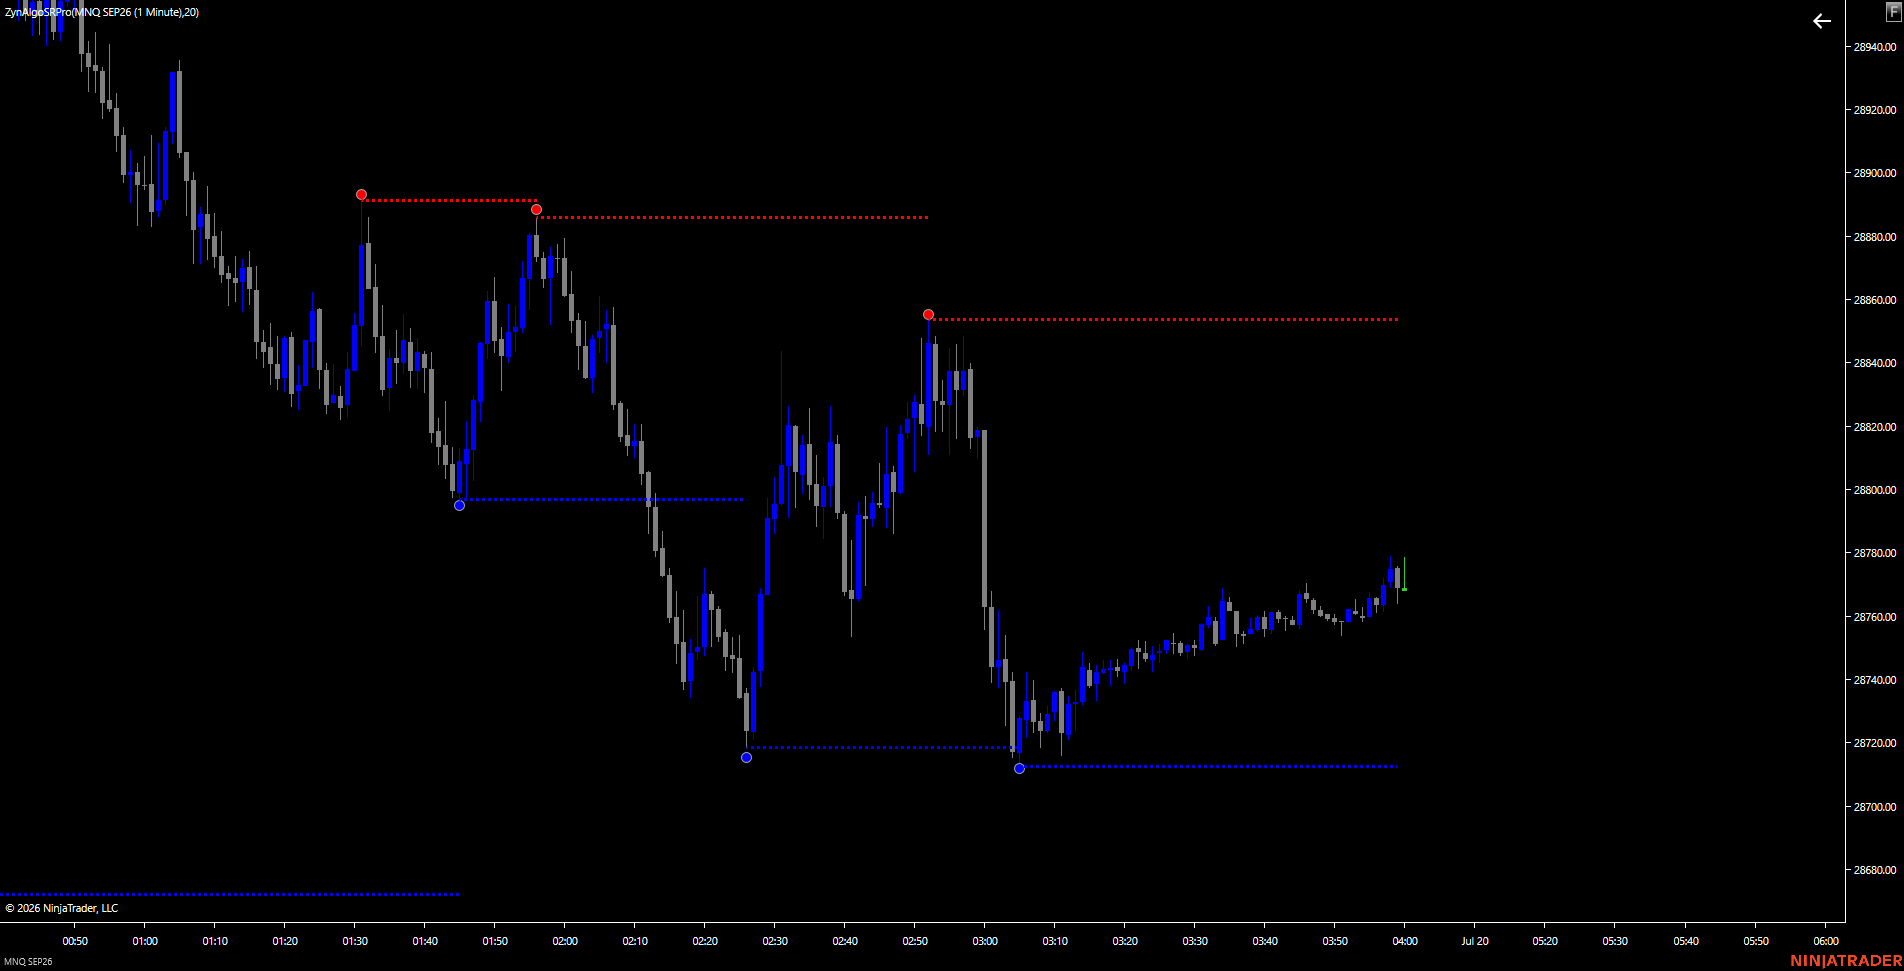
- Buy-side liquidity is plotted at the most recent confirmed swing high - red by default.
- Sell-side liquidity is plotted at the most recent confirmed swing low - blue by default.
- Each line begins at the actual pivot bar and extends right to the current bar, so the level stays visible while it matters.
- A line stops only when a new swing of the same type is confirmed - it does not stop because price touched it.
- The newest line of each colour is the level currently in play; older lines remain as a record of past structure.
A common mistake - Many traders see price break a swing high and treat it as a confirmed breakout, so they chase it. Very often that move is simply a raid on the liquidity sitting above the high: the orders get collected and price returns. The second frequent mistake is expecting the swing marker to appear on the exact candle that made the high. It cannot - a pivot needs bars on both sides before it can be confirmed, so the marker always arrives later and is drawn back onto the correct bar.
How a liquidity level is defined
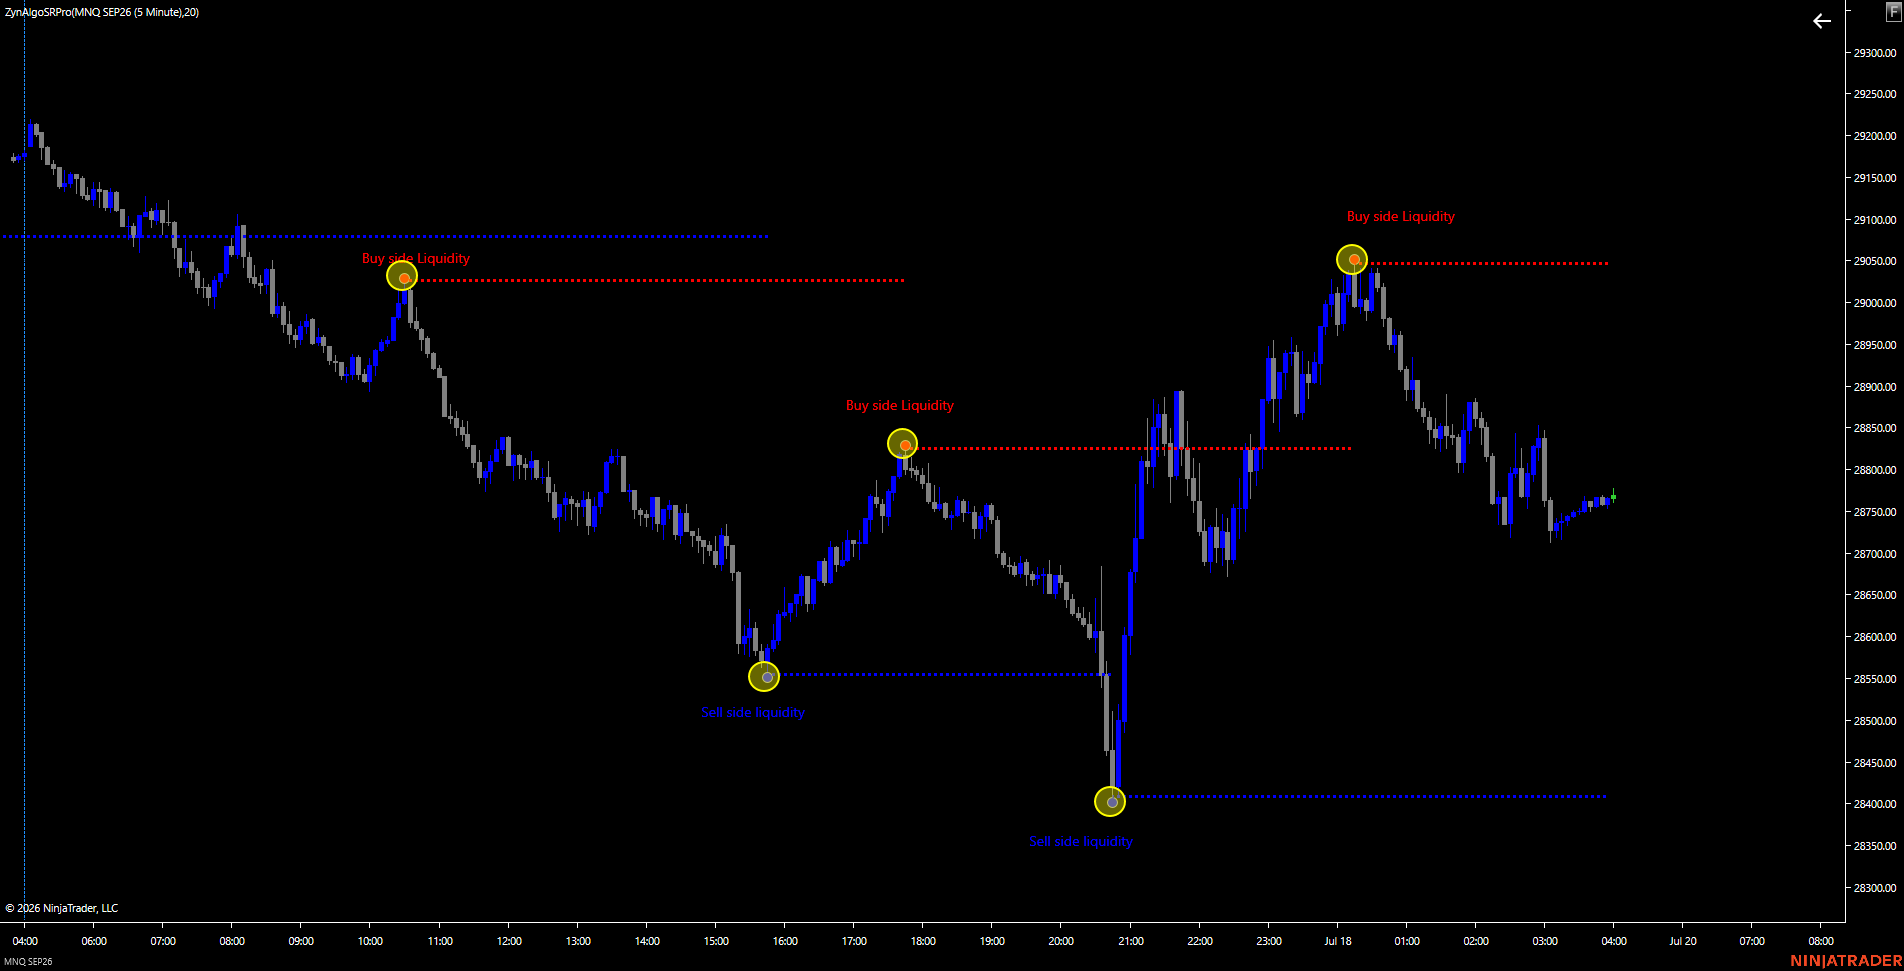
Nothing here is estimated or weighted. A level exists only when the pivot condition is fully met on closed bars, and the level is the exact price of that pivot bar.
- Pivot high / pivot low detection - finds a bar whose high (or low) is the most extreme within the window on both sides.
- Left bar & Right bar (default 20) - the pivot depth. Lower values confirm swings faster but produce more noise; higher values keep only more significant swings but confirm later.
- Confirmed-bar processing - pivots are only evaluated once a bar has closed, so a level never appears from an unfinished candle.
- Last swing high = the high of the pivot bar; last swing low = the low of the pivot bar. That exact price becomes the liquidity line.
- Circle markers - plotted with a negative offset so they land on the true pivot bar, above it for a swing high and below it for a swing low.
- Line width, line style and the two colours - display controls only; they change nothing in the logic.
Reading the signals
ZynAlgo S&R Pro does not generate BUY or SELL entries, and it draws no arrows, targets or stops. What it gives you is a live answer to two questions: where is the nearest liquidity, and has price reached it? Reading it works like this.
- Find the two active lines - the most recent buy-side line above price and the most recent sell-side line below it. Those are the two nearest liquidity targets.
- The alerts 'Swing High Created' and 'Swing Low Created' tell you a new reference level now exists. Remember they arrive with the pivot delay set by Left bar & Right bar.
- The alert 'Price reached buy side liquidity' fires when the bar's high crosses above the last swing high.
- The alert 'Price reached sell side liquidity' fires when the bar's low crosses below the last swing low.
- A raid alert is an attention signal, not a reversal call - the indicator makes no directional conclusion, so your own confirmation and risk plan decide the trade.
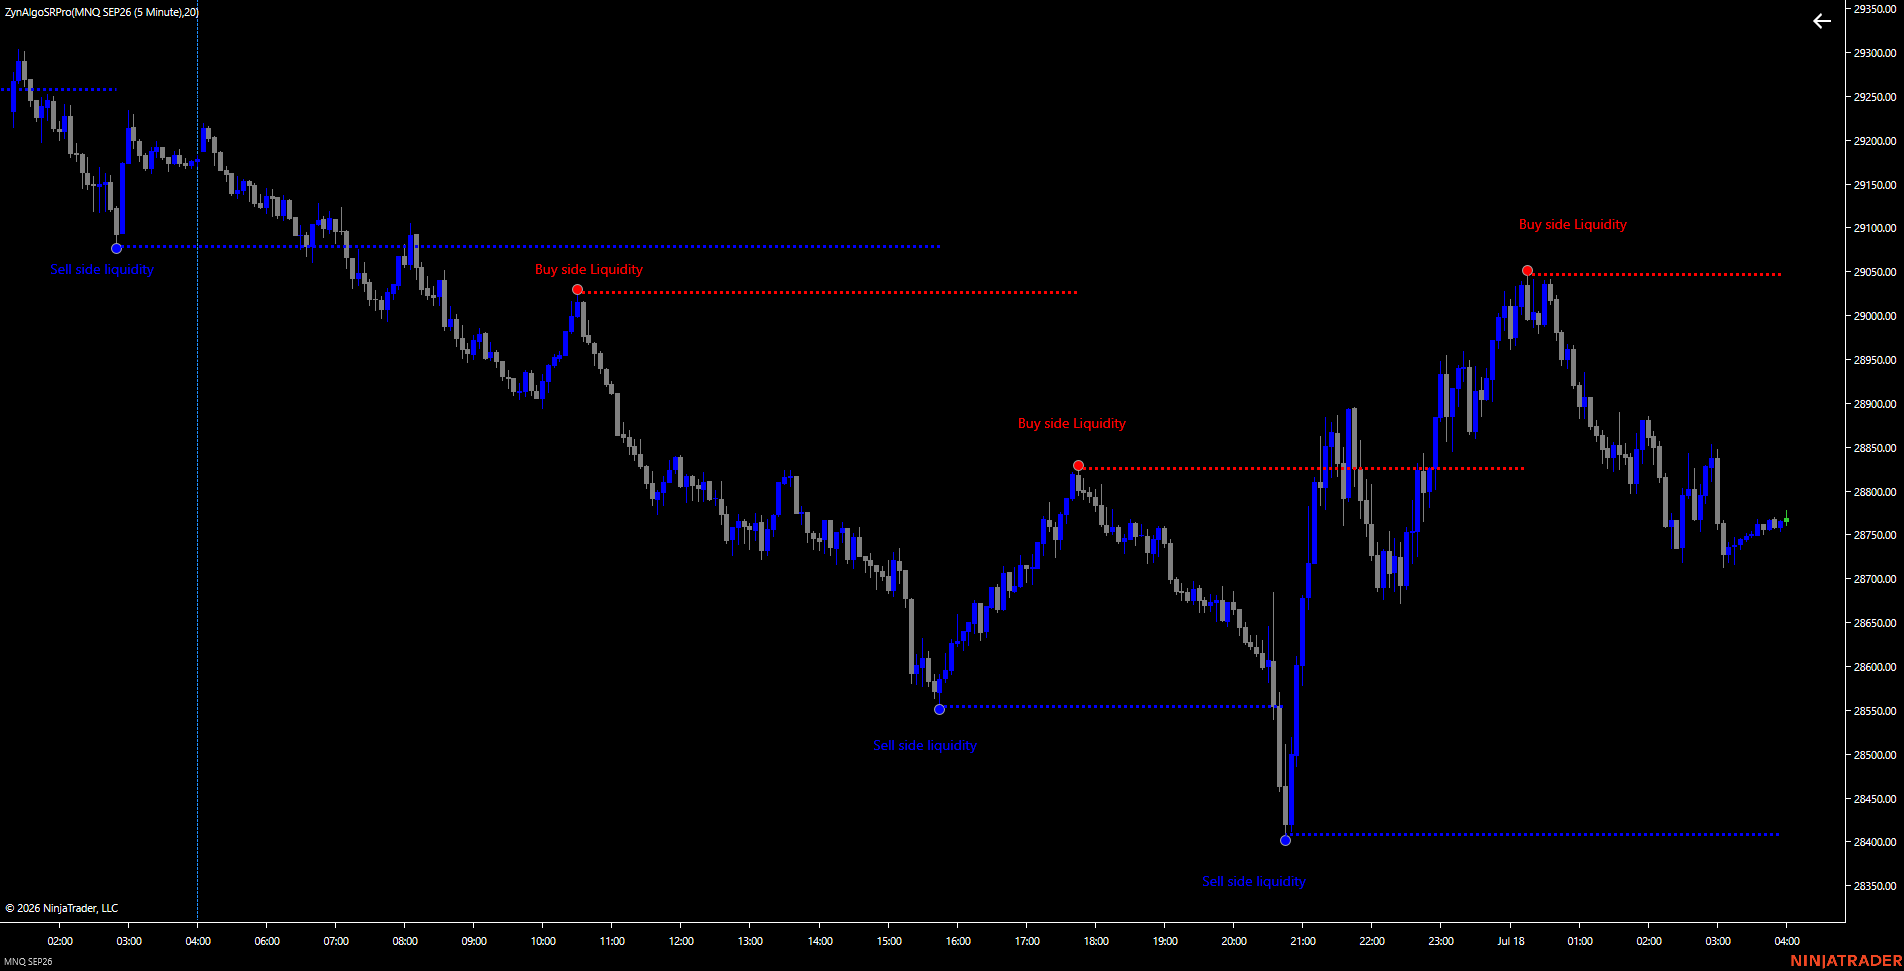
Once a level has been reached, the chart still tells you a lot about what happened there:
- Whether price closed beyond the level or only wicked through it and closed back inside.
- Whether an opposite swing forms shortly after the raid, which is how structure shifts become visible.
- The candle colouring layer, which shades each bar by close versus previous close for a quick read of short-term follow-through.
- The raided line continuing to extend to the right, a reminder that the level is still on the chart until the next same-type swing is confirmed.
Best suited for
- Traders who work with market structure, liquidity and smart-money concepts and want those levels drawn objectively instead of by hand.
- Discretionary traders who prefer a clean overlay that frames the chart and leaves the entry decision to them.
- Any market and timeframe available on NinjaTrader 8 - tune the pivot depth so the swings match the timeframe you trade.
- Traders who rely on alerts rather than watching the screen, thanks to the four built-in alert conditions.
Knowing where liquidity is resting is usually worth more than reacting to every break of a high or a low. S&R Pro is built around that idea: fewer things on the chart, but the ones that are there mean something.
Browse the ZynAlgo marketplace
Trading involves risk. This indicator is an analysis tool and does not guarantee any result.
- ZynAlgo S&R Pro v1Jul 21, 2026
Initial release
Why swing highs and lows alone don't tell you where liquidity sits
You see the swing, but you don't know if price will respect it or raid it. S&R Pro maps buy-side and sell-side liquidity objectively so you stop guessing where the orders are parked.
Why your entries get hit when liquidity pools are raided
You enter at a breakout, the stop gets hit, then price reverses. The liquidity sitting at swing points is being raided, not traded. Here's how to see it in real time.