Renko Trend Heatmap
Renko Trend Heatmap maps a stepped brick structure onto your normal chart, so you get brick-chart clarity without giving up the timing and volume information you already use.
Key benefits
- Adaptive sizing: bricks compress in quiet markets and expand in volatile ones.
- Volume-gated turns: a state change is only reported when participation backs it.
- Streak shading: colour depth shows how long the current run has held.
How it works It sizes each brick from volatility scaled by current dispersion, tracks the structural state and streak depth internally, then marks direction changes that meet your volume threshold. The full walkthrough is in the Manual.
What's included / Platforms NinjaTrader 8 indicator, lifetime or membership access.
Best for Trend traders who want brick-chart structure on a time-based chart, with volume confirmation built in.
Get started See it on zynassets.com/marketplace.
Disclaimer: Trading involves risk. The internal structure is an approximation and does not guarantee future results.
Renko Trend Heatmap
Renko Trend Heatmap in one idea
Brick charts strip out time and show only meaningful price movement, which is why they look so clean. The problem is that they normally live on their own chart type, away from the timing and volume information you use for everything else.
This tool builds the brick structure internally from real price and draws it over your normal time-based chart. You keep your candles, your session structure and your volume, and gain a stepped trend structure on top of them.
Two things make it more than a visual overlay: the brick size adapts to conditions rather than staying fixed, and every direction change has to be paid for in volume before it is reported, on NinjaTrader 8.
Inside Renko Trend Heatmap: the adaptive brick
A fixed brick size is always wrong somewhere. Too small and a quiet market produces constant flips; too large and a volatile market gives you almost no information at all.
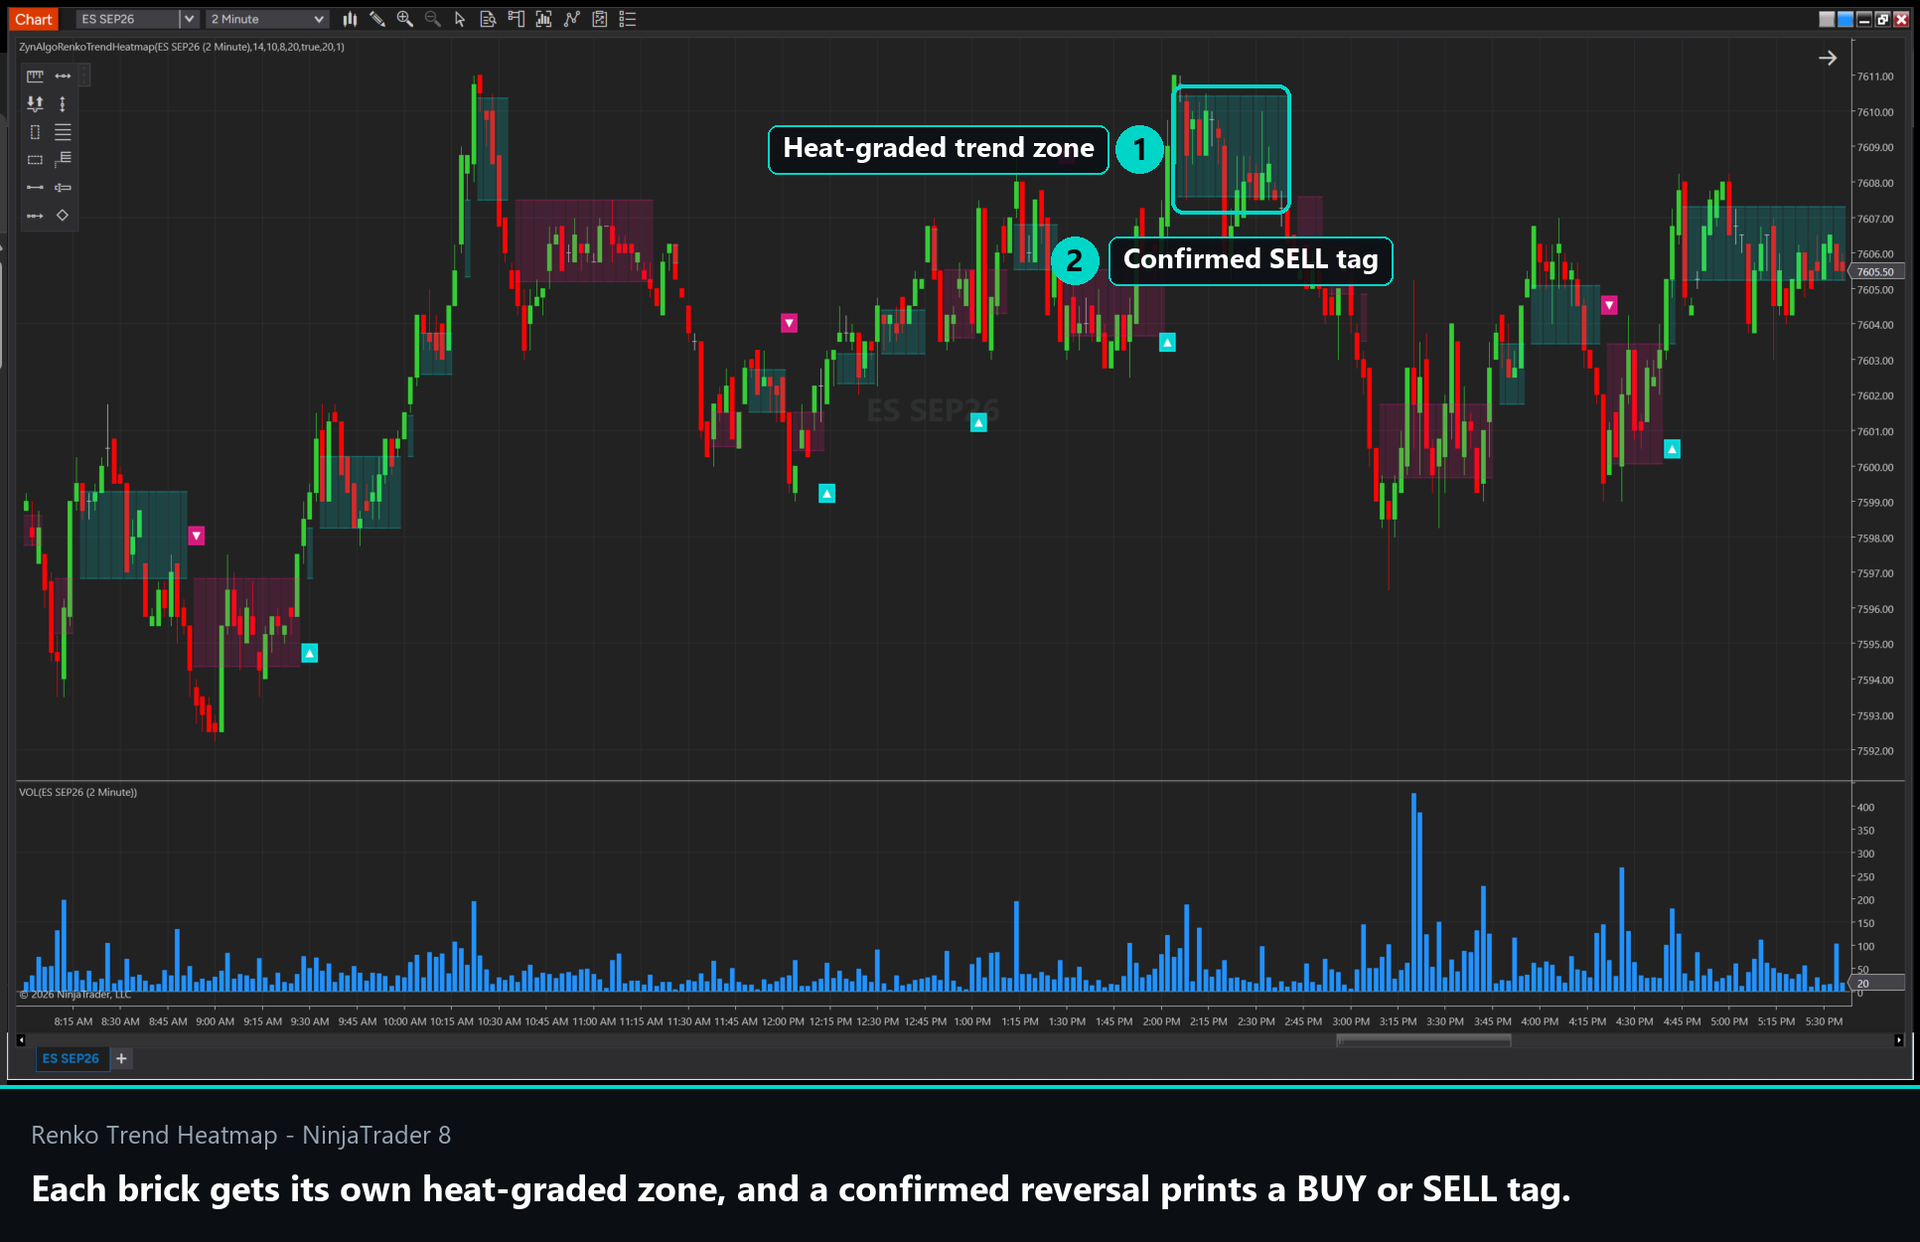
- The stepped band shows the current structural state and moves only when price has travelled a full brick beyond the last one.
- Its colour intensity tracks how long the current run has lasted, so a deepening shade means a streak that keeps extending.
- A pale band means the structure has only just turned. That distinction is worth more than it looks.
How the brick size is defined
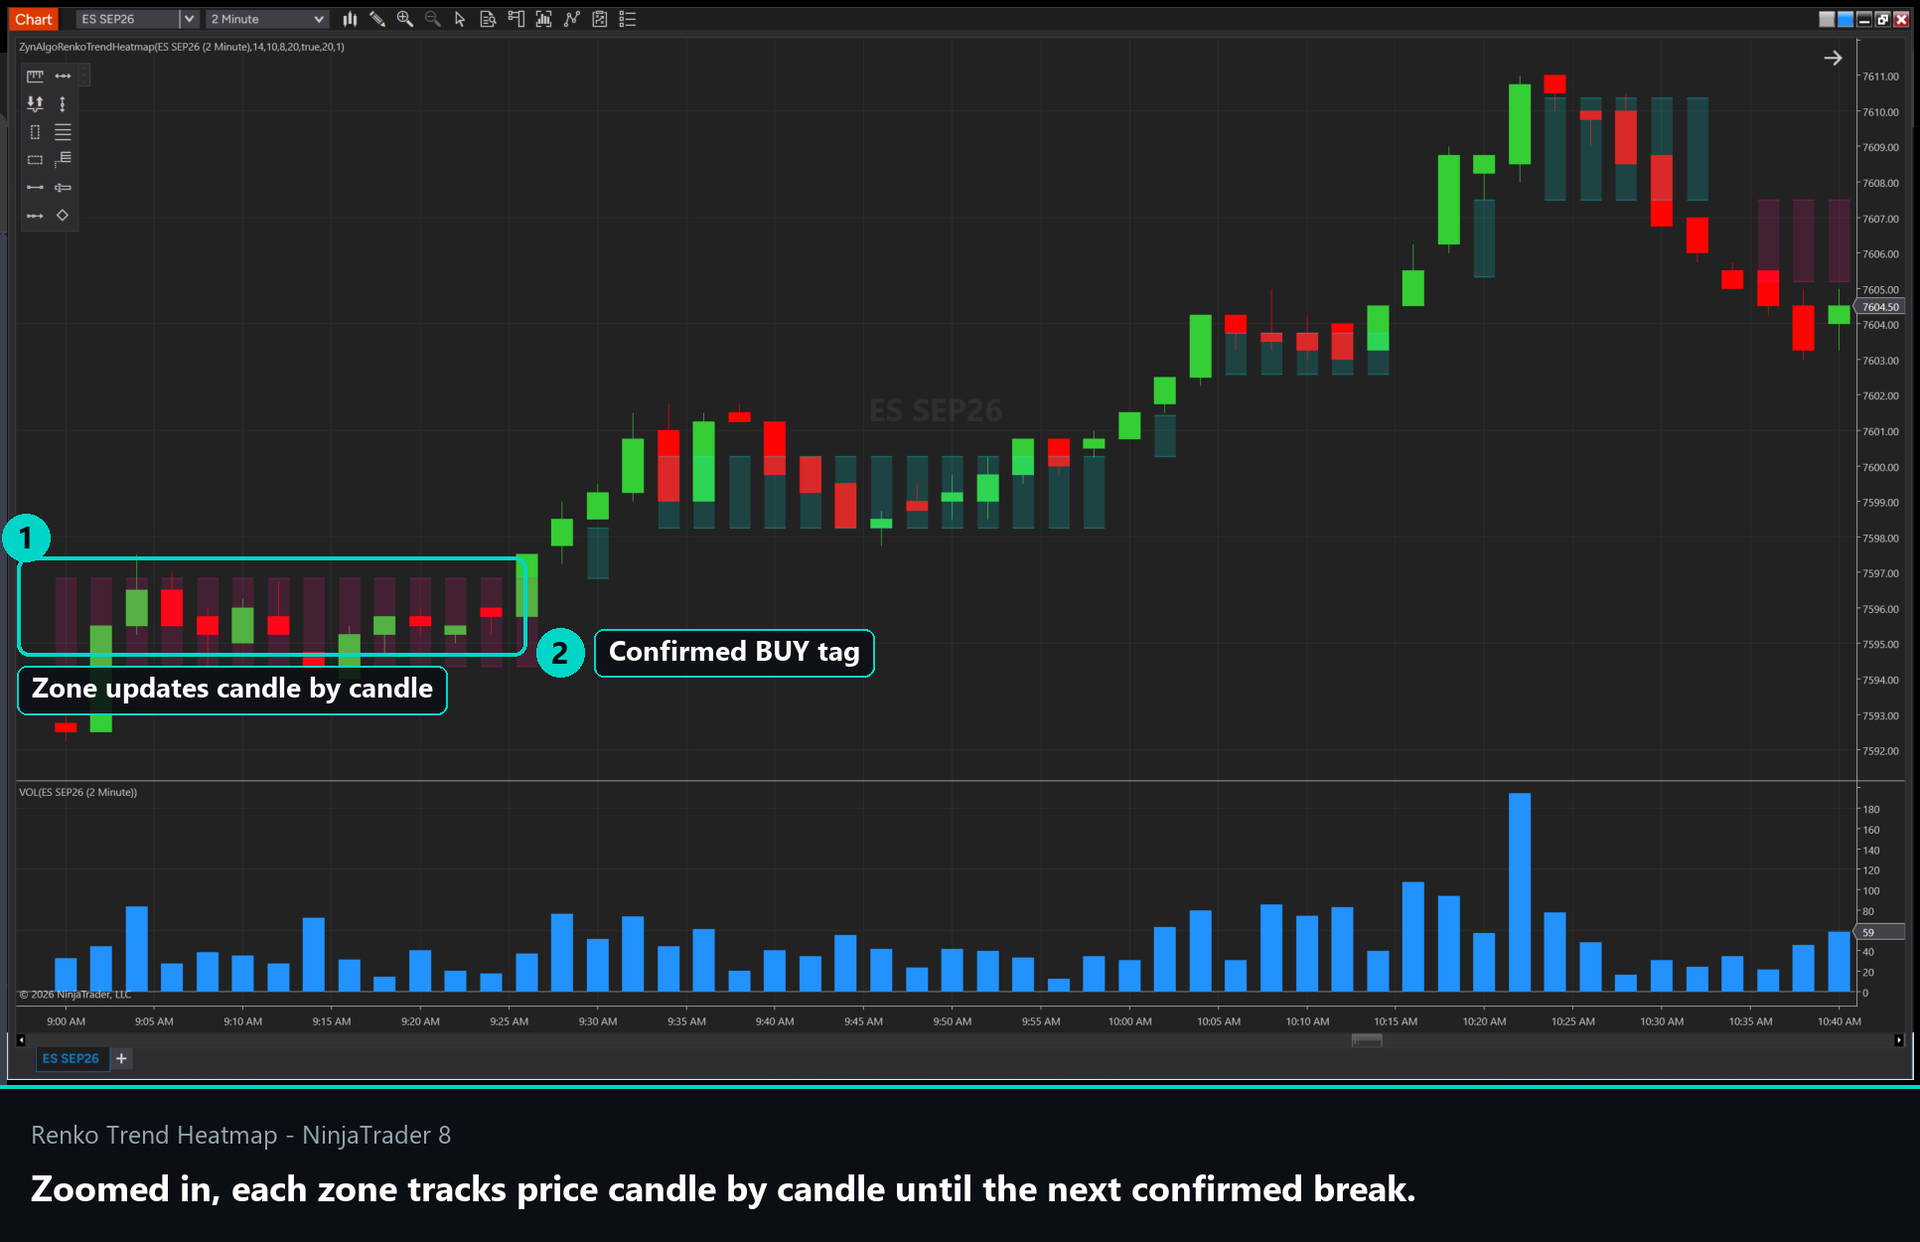
- A volatility measure gives the base size, then a ratio between current dispersion and its own longer-term average scales it up or down.
- That scaling is capped in both directions, so the brick can roughly halve or double from base but never runs away.
- The practical effect: in quiet ranges the bricks compress and the structure stays responsive; in fast conditions they expand so ordinary swings do not flip the state.
- The structure is calculated from actual price movement on your chart rather than from a synthetic feed, so what you see is derived from the bars in front of you.
Trading the state change
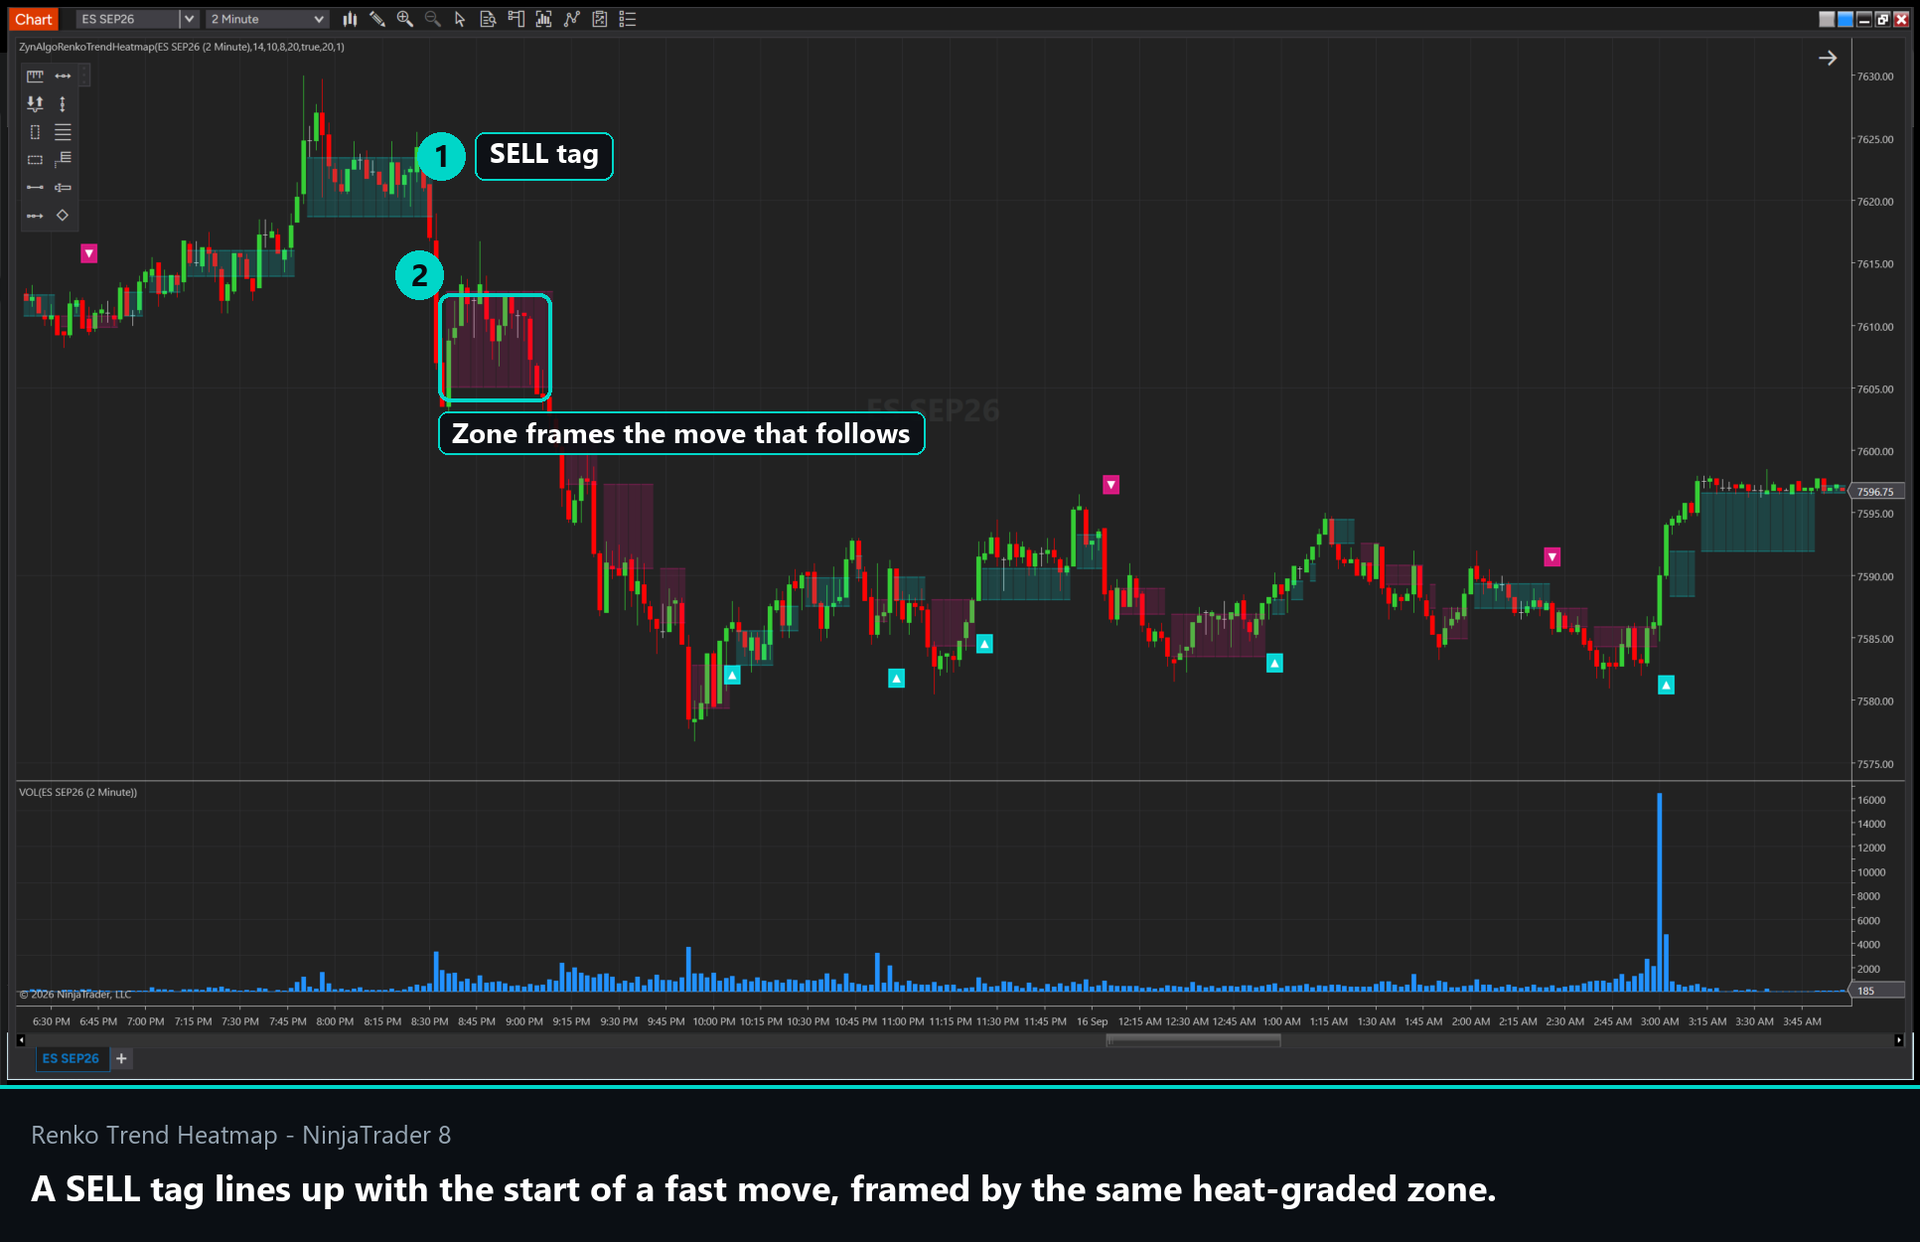
A marker requires two things together:
- The internal structure completes a brick in the opposite direction, changing the state from bullish to bearish or the reverse.
- Volume on the confirming bar is at or above its recent average multiplied by your threshold setting.
The second condition is the one that removes most false turns. A structural flip on thin participation is exactly the pattern that reverses again a few bars later, and without the volume requirement this tool would report every one of them.
Raising the volume multiplier makes markers rarer and generally cleaner. Lowering it toward one accepts any average-volume turn. If you are seeing more markers than you want in a chopping market, that setting is the first place to look, not the brick sizing.
Be realistic about the limitation: a brick structure recalculated on a time-based chart is an approximation, and in a sideways market the state can change repeatedly regardless of how the sizing adapts.
Who should use Renko Trend Heatmap?
- Trend traders who like brick-chart clarity but do not want to give up time-based charts to get it.
- Traders who need volume as a hard condition on trend changes rather than a separate thing to check.
- Anyone who wants to distinguish a young trend from a mature one at a glance.
The stepped structure tells you the direction. The shade tells you how long it has held. The volume decides whether the change was worth reporting at all.
Browse the full ZynAlgo catalogue at zynassets.com/marketplace.
Trading involves risk. The internal brick structure is an approximation on time-based charts, and volume filters can reject valid moves or allow false ones.
- Renko Trend Heatmap [ZynAlgo] v1Jul 17, 2026
Initial release