Quant Regime Classifier
Not every market deserves the same playbook. ZynAlgo Quant Regime Classifier is a market regime classifier for NinjaTrader 8 that sorts price action into bullish, neutral and bearish statistical regimes, so you stop running a breakout plan inside a dead range.
Key benefits
- Know the regime before you risk anything - one colour-coded panel calls bull, chop or bear on every closed bar.
- Fewer trades in dead markets - the neutral cluster makes chop obvious instead of tempting.
- Early regime-shift tags - EB and ES labels print on the price chart when the market leaves an extreme cluster.
- Exhaustion warnings - gold OX+ and OX- tags flag statistically stretched conditions.
- Keeps the system you already trade - it filters context; your entry rules stay yours.
How it works
Six oscillators - RSI, CCI, Fisher, DMI, price Z-Score and moving-average ratio - are normalized into z-scores over a 1000-bar lookback, then measured against cluster centres built from percentiles of their own history. The nearest cluster becomes the current regime. Full logic is in the Manual.
What's included / Platforms
NinjaTrader 8 indicator (NinjaScript), delivered for installation in NinjaTrader 8 with licensed indicator access: six switchable cores, 2- or 3-cluster mode, regime aura, on-chart tags and a configurable X-Ray HUD dashboard.
Best for
FX majors, indices, gold and major crypto on H1 and higher - swing and intraday traders who already have an entry trigger and need better context around it.
Get started
Add ZynAlgo Quant Regime Classifier to your charts from the ZynAlgo marketplace. Trading involves risk: this indicator provides market context, not financial advice, and no result is promised.
Quant Regime Classifier
What ZynAlgo Quant Regime Classifier measures - and what it ignores
ZynAlgo Quant Regime Classifier is a context tool, not another trend line to trade off. It lives in its own panel under the chart and answers a single question on every confirmed bar: which statistical state is this market in right now - bullish, neutral (chop), or bearish?
Six oscillator "cores" feed the engine. Each one is normalized into a z-score over a long lookback, so a reading on gold means the same thing as a reading on an index future:
- RSI Core (length 14 by default)
- CCI Core (length 20)
- Fisher Transform Core (length 9)
- DMI Core (length 9) - the raw DI+ minus DI- spread
- Z-Score Core (length 20) - how far close sits from its own mean, in standard deviations
- MAR Core (length 14, SMA or EMA) - close divided by its moving average
What it deliberately ignores matters just as much. There is no volume or order-flow input, no higher-timeframe confirmation, no news filter, and no stop-loss, take-profit or position-sizing logic. It also makes no price forecast and shows no performance statistics. Everything you see is derived from price alone. The payoff is one honest, colour-coded read of market context on NinjaTrader 8 that you can place in front of whatever entry method you already trade.
Percentile regime clustering explained
Markets do not behave the same way all the time. The same breakout rule that prints money in an expanding trend bleeds slowly inside a range. Percentile regime clustering is simply a way of putting a name on the market you are actually looking at, using its own recent history as the yardstick rather than fixed textbook levels. The classifier never predicts - it labels.
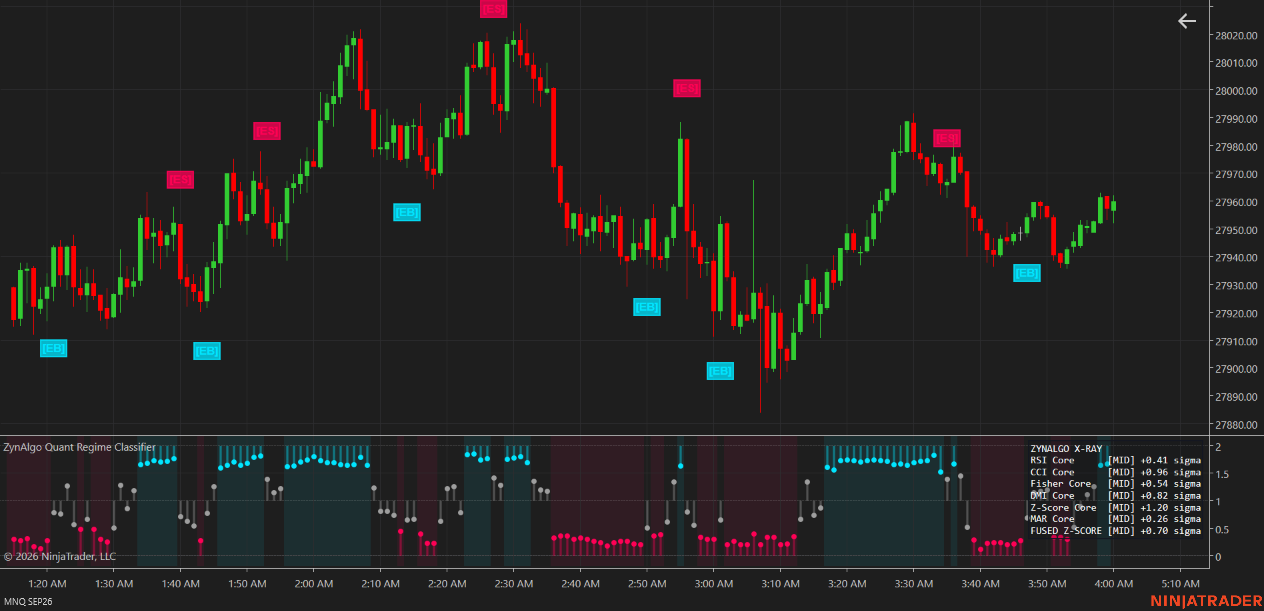
With the default setting of 3 clusters, every confirmed bar is placed in exactly one of three regimes:
- Bullish regime (cluster K2, ZynAlgo cyan) - the fused readings sit near the upper end of their own recent distribution; the panel background is tinted cyan.
- Neutral / chop regime (cluster K1, gray) - readings hover around their own long-run mean. This is the only regime that gets NO background tint, so a plain panel means "no regime edge".
- Bearish regime (cluster K0, ZynAlgo crimson) - readings sit near the lower end of the distribution; the panel background is tinted crimson.
Switching the K Clusters input to 2 removes the chop bucket entirely and leaves only bearish (K0) and bullish (K1). Three clusters is the recommended default precisely because the middle state is the one most traders refuse to admit exists.
That is the common mistake this tool is built against: reading one oscillator's absolute level ("RSI is 70, so it is overbought") and applying the same playbook everywhere. An RSI of 70 in a quiet range and an RSI of 70 in a strong trend are not the same event, and treating them the same way is how good entry rules get blamed for bad context.
How percentile regime clustering is defined
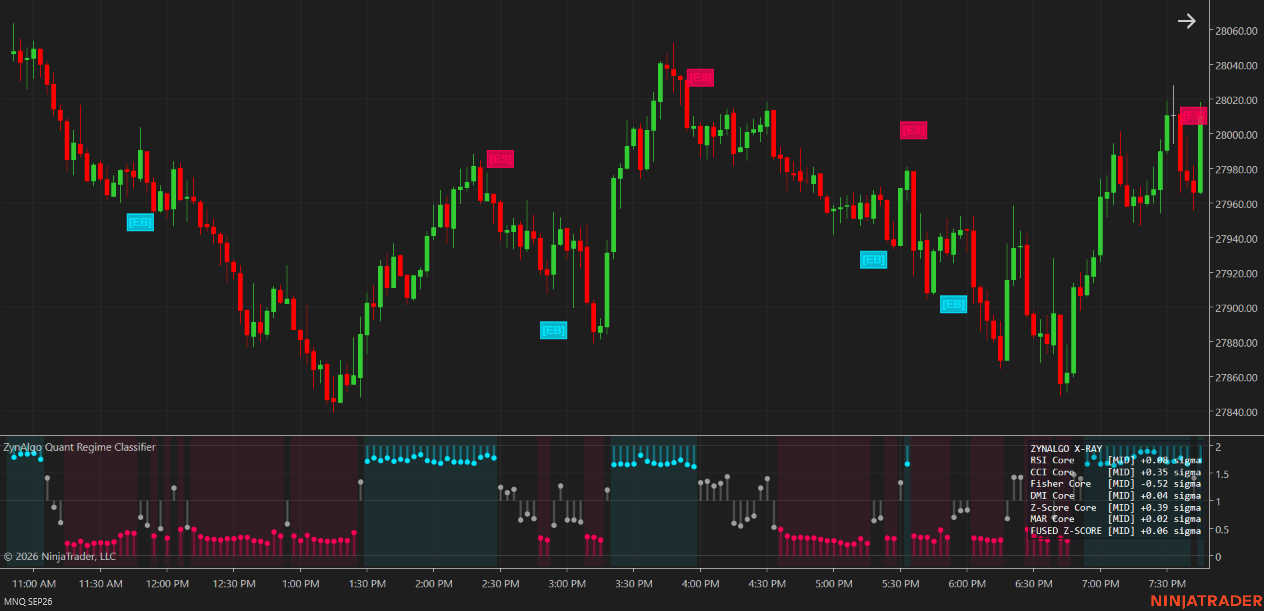
- Feature normalization - each of the six cores is converted to a z-score across the Lookback Horizon (1000 bars by default), so raw units disappear and the cores become comparable.
- Cluster centres - for every core, the engine keeps a rolling sorted history and reads the Lower Percentile (5 by default) and Upper Percentile (95), plus a mid value (the moving average of the core over the lookback). The bear centre is the midpoint of low percentile and mid; the chop centre is the mid itself; the bull centre is the midpoint of upper percentile and mid.
- Distance fusion - the current value of each active core is measured against each cluster centre, and those distances are averaged across only the cores you left switched on. The nearest cluster wins and becomes the bar's regime.
- Regime Flow Line - instead of a hard staircase, the plotted line interpolates between the nearest and second-nearest cluster, so you can see the market drifting toward the next regime before it formally flips. Dashed guides sit at 0, 1 and 2, with a histogram anchored to the active cluster level.
- FUSED Z-SCORE - the average of all active normalized cores. This single number is what drives the exhaustion warnings described below.
- X-Ray HUD - an optional table (position and text size are configurable) listing every active core with its current z-score, tagged [+] above +1.5, [-] below -1.5 and [~] in between, with the FUSED Z-SCORE on the bottom row.
Entry rules with ZynAlgo Quant Regime Classifier
The signal logic here is state-based, not zone-based and not a crossover. Nothing fires because a line was touched; tags print only when the classified cluster actually CHANGES, and only on a confirmed (closed) bar, so nothing appears and then disappears mid-candle. Although the engine runs in the lower panel, the tags are pushed onto the price chart itself.
- [EB] - Early Bull. Printed below the candle in cyan when the cluster index steps UP and the previous bar was in the lowest cluster (K0, bearish). Read it as: the bearish regime is ending. Bias turns long-side.
- [ES] - Early Short. Printed above the candle in crimson when the cluster index steps DOWN and the previous bar was in the highest cluster (K2 when using 3 clusters, K1 when using 2). Read it as: the bullish regime is ending. Bias turns short-side.
- One tag per swing. A state machine locks the direction after each tag, so an [EB] cannot repeat until an [ES] has appeared and vice versa - this is what keeps the chart clean when price rattles around a cluster boundary.
- [OX+] - Overextended Bullish. A gold tag above the candle when the FUSED Z-SCORE crosses above +2.5. This is a caution flag on an already stretched market, not a sell signal.
- [OX-] - Overextended Bearish. A gold tag below the candle when the FUSED Z-SCORE crosses below -2.5, i.e. selling has become statistically extreme. Both warnings re-arm only after the fused score cools back inside the +/-1.0 band.
Every tag carries a tooltip: hover it and the indicator spells out in plain English which condition triggered it, so you never have to guess what a marker on your chart means.
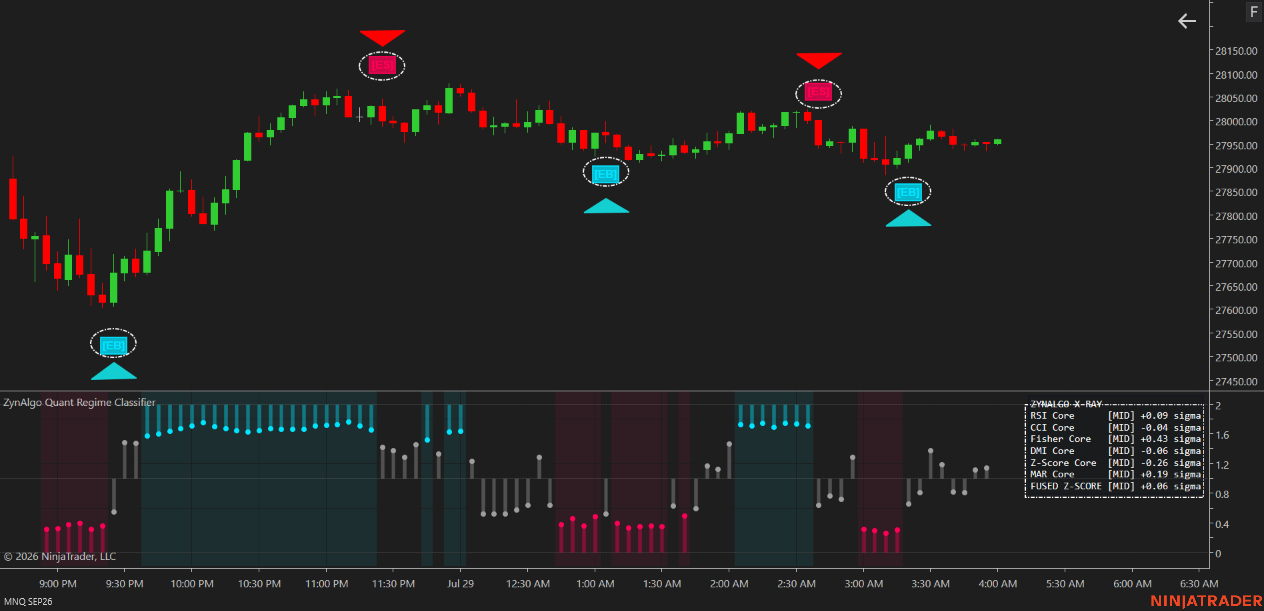
How to use them in practice - the classifier gives you context and a bias, never a full trade plan. Typical readings:
- Panel crimson, then an [EB] appears - a downtrend is losing its statistical grip. Look for your own long trigger rather than buying the tag blindly.
- Panel cyan, then an [ES] appears - the up-phase is breaking down. Existing longs are the first thing to review.
- Panel plain gray (chop cluster) - the fused readings are hugging their mean. This is the state to trade smaller in, or to sit out entirely.
- [OX+] while you are already long - the market is stretched, so managing the position (tighter stop, partial profit) usually beats flipping short into strength. [OX-] is the mirror case.
Because the indicator contains no stop-loss, target or sizing logic, those decisions stay with your own risk plan.
Who should use ZynAlgo Quant Regime Classifier?
- Swing and intraday traders on liquid instruments - FX majors, indices, gold, large-cap crypto - on H1 and higher, where 1000 bars of clean history are available for the clustering to be meaningful.
- Traders who already own a working entry trigger and keep losing on it in the wrong market; the classifier is the filter in front of it, not a replacement for it.
- Confluence and top-down traders who want one objective regime read instead of eyeballing six oscillators separately.
- Anyone who knows they over-trade ranges and wants the chop state made visually obvious.
It is a poor fit if you want a complete entry-and-exit system out of the box, or if you trade thin symbols and very short histories where a 1000-bar lookback simply does not exist.
The edge is not in taking more trades - it is in knowing which market you are standing in before you take any. Used honestly, that is what this tool buys you. It does not remove risk: markets can change regime against you, and no classifier can promise a result.
- Quant Regime Classifier v1Jul 21, 2026
Initial release