Donchian Trap Retest Matrix
Chasing the first breakout is how traders get trapped. Donchian Trap Retest Matrix turns the Donchian channel into an always-visible trap map on MetaTrader 4: it waits for a failed breach of a boundary, then fires on the retest instead of the break.
Key benefits
- The channel as a trap map - upper and lower bands, the midline and the failed-break levels are drawn live, so you see where traps set up
- Retest, not chase - a signal needs a boundary pierce that fails and reclaims, then a trigger close, so you are trading the trap of the late breakout crowd
- Two tiers - a regular trigger plus a strong tier that adds a dominant wick and a tick-volume surge
- Risk already measured - stop beyond the failed sweep extreme plus 0.25 ATR, targets at 1R and the opposite Donchian side
How it works
Price pierces the Donchian lower band by at least 0.15 ATR, closes back above it within 1-3 bars, then a trigger candle closes above the reclaim bar's high while a 20-EMA baseline agrees - a BUY. The strong tier adds a lower wick over 55% of range and tick volume above 1.2x average. Shorts mirror it, all on closed candles. Full rule set is in the Manual.
What's included
MetaTrader 4 indicator file (.ex4), with Donchian and EMA lengths, reclaim window, sweep and wick thresholds, volume multiplier and spread cap open in the Inputs tab.
Best for
Intraday traders on gold M5-M15, indices M1-M15 and forex majors M5-M30 who fade failed breakouts and want the first retest instead of the first break.
Get access
-> Browse the ZynAlgo marketplace
Trading involves risk. This indicator is an analysis tool for educational purposes and does not guarantee results.
Donchian Trap Retest Matrix
What has to line up before a signal can print
Donchian Trap Retest Matrix is a failed-breakout signal indicator for MetaTrader 4. It is built around one recurring trap: price breaches a Donchian boundary, traders chase it, and it reverses. Rather than signal the break, it waits for the break to fail and signals the retest.
Every closed candle is measured against:
- Channel - the 20-period Donchian upper band, lower band and midline
- Failed breach - a pierce beyond a band by at least 0.15 ATR that closes back inside within 1-3 bars
- Trigger - a candle closing beyond the reclaim bar's extreme with a 20-EMA baseline agreeing
- Strength - an optional dominant wick and tick-volume surge that separate a strong signal from a regular one
- Context filters - ATR floor, spread cap, trigger-body size and minimum channel width
Only when the failed breach and the trigger agree does a BUY or SELL arrive, and the setup stays armed for 5 bars so it can fire repeatedly on active M5/M15 markets.
The trap map and the failed break
Most Donchian tools signal the breakout. This one maps the trap, because on intraday gold, indices and FX the first breach of a channel edge fails far more often than it runs.
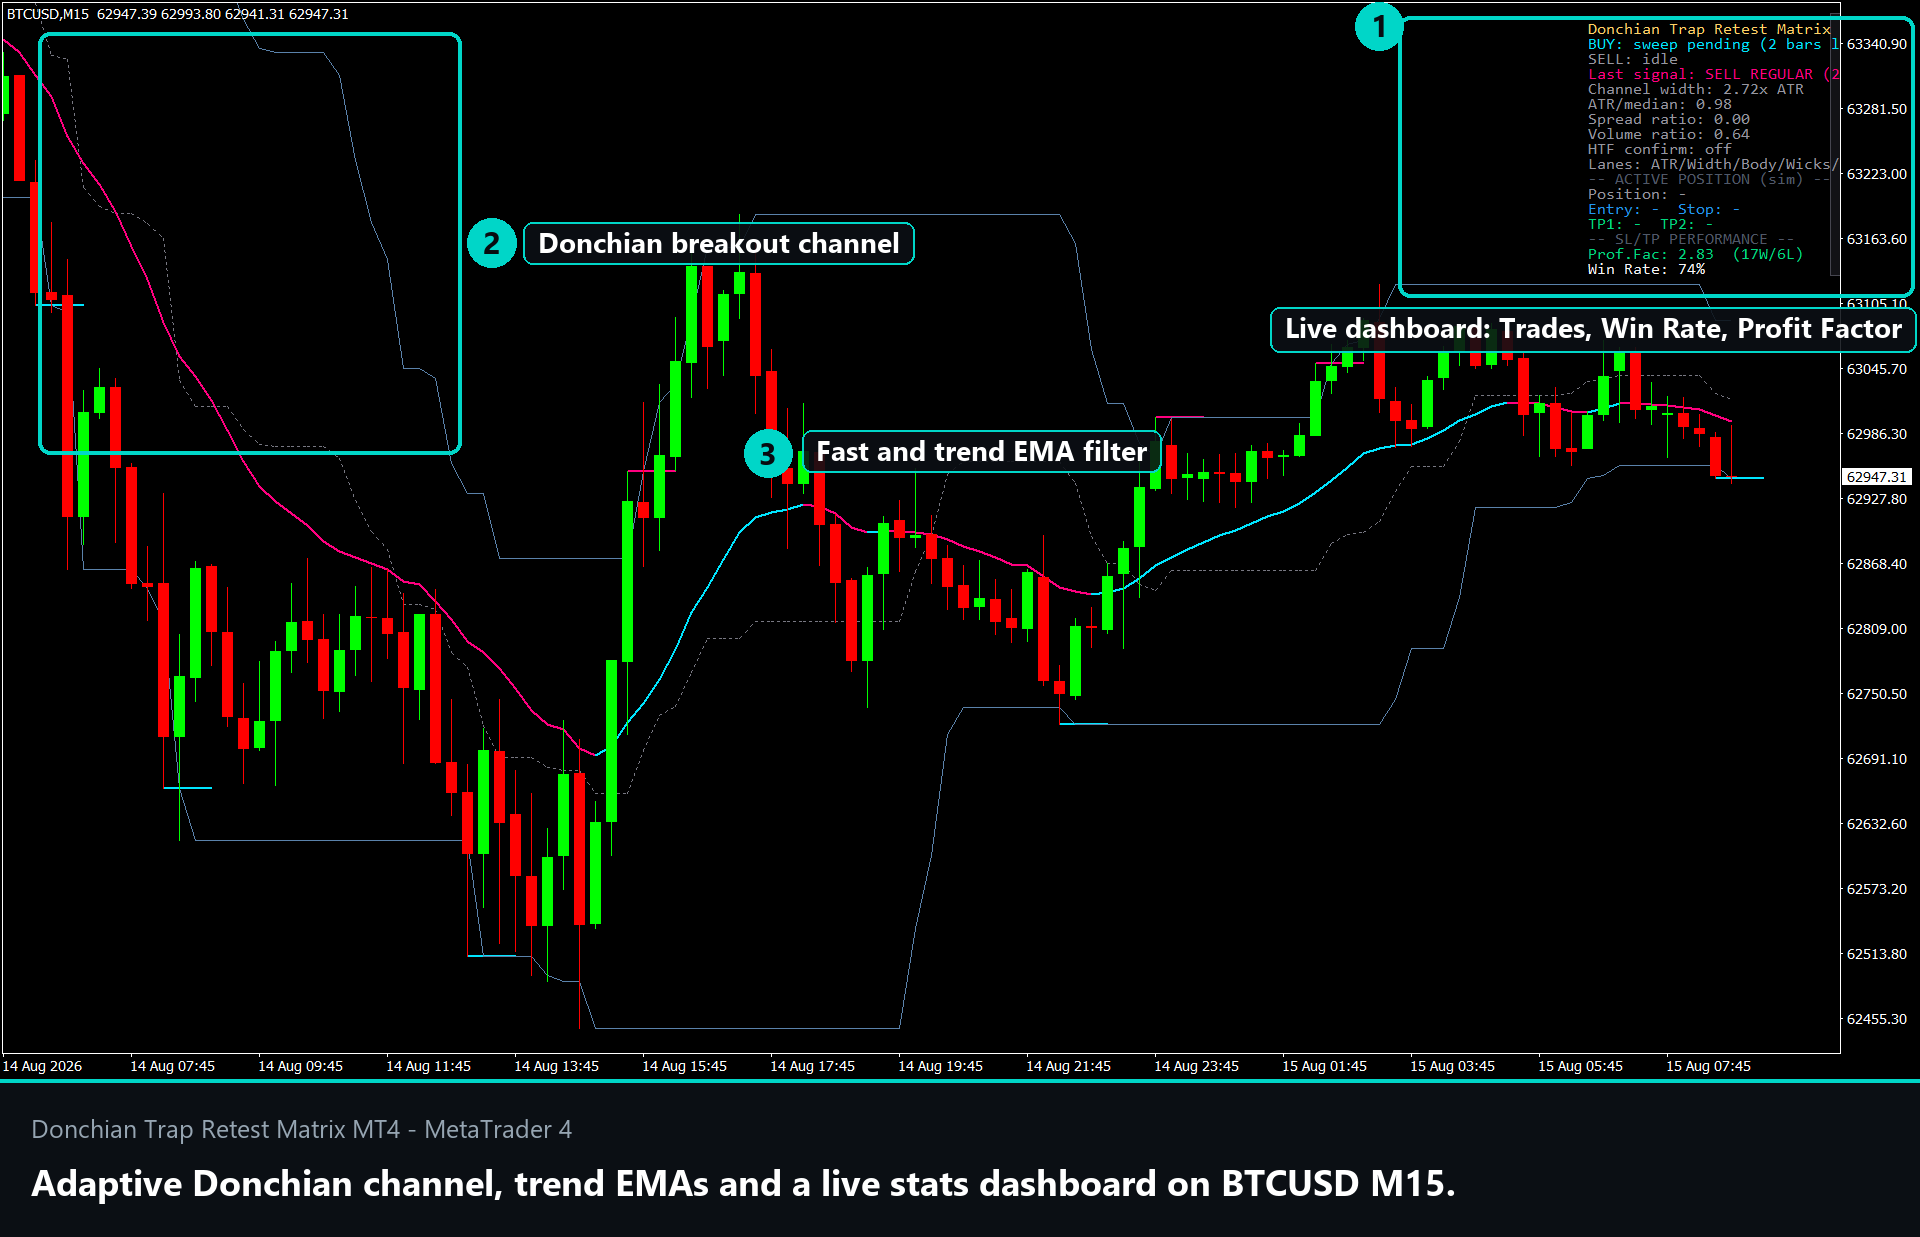
- The shaded channel, midline and EMA-slope ribbon show the trend context around the bands
- A failed-break level is marked when price pierces a band and closes back inside, arming a trap in the opposite direction
- The mistake this is built around is buying the first close beyond the band - exactly the entry the retest is designed to fade
How the trap and trigger are defined
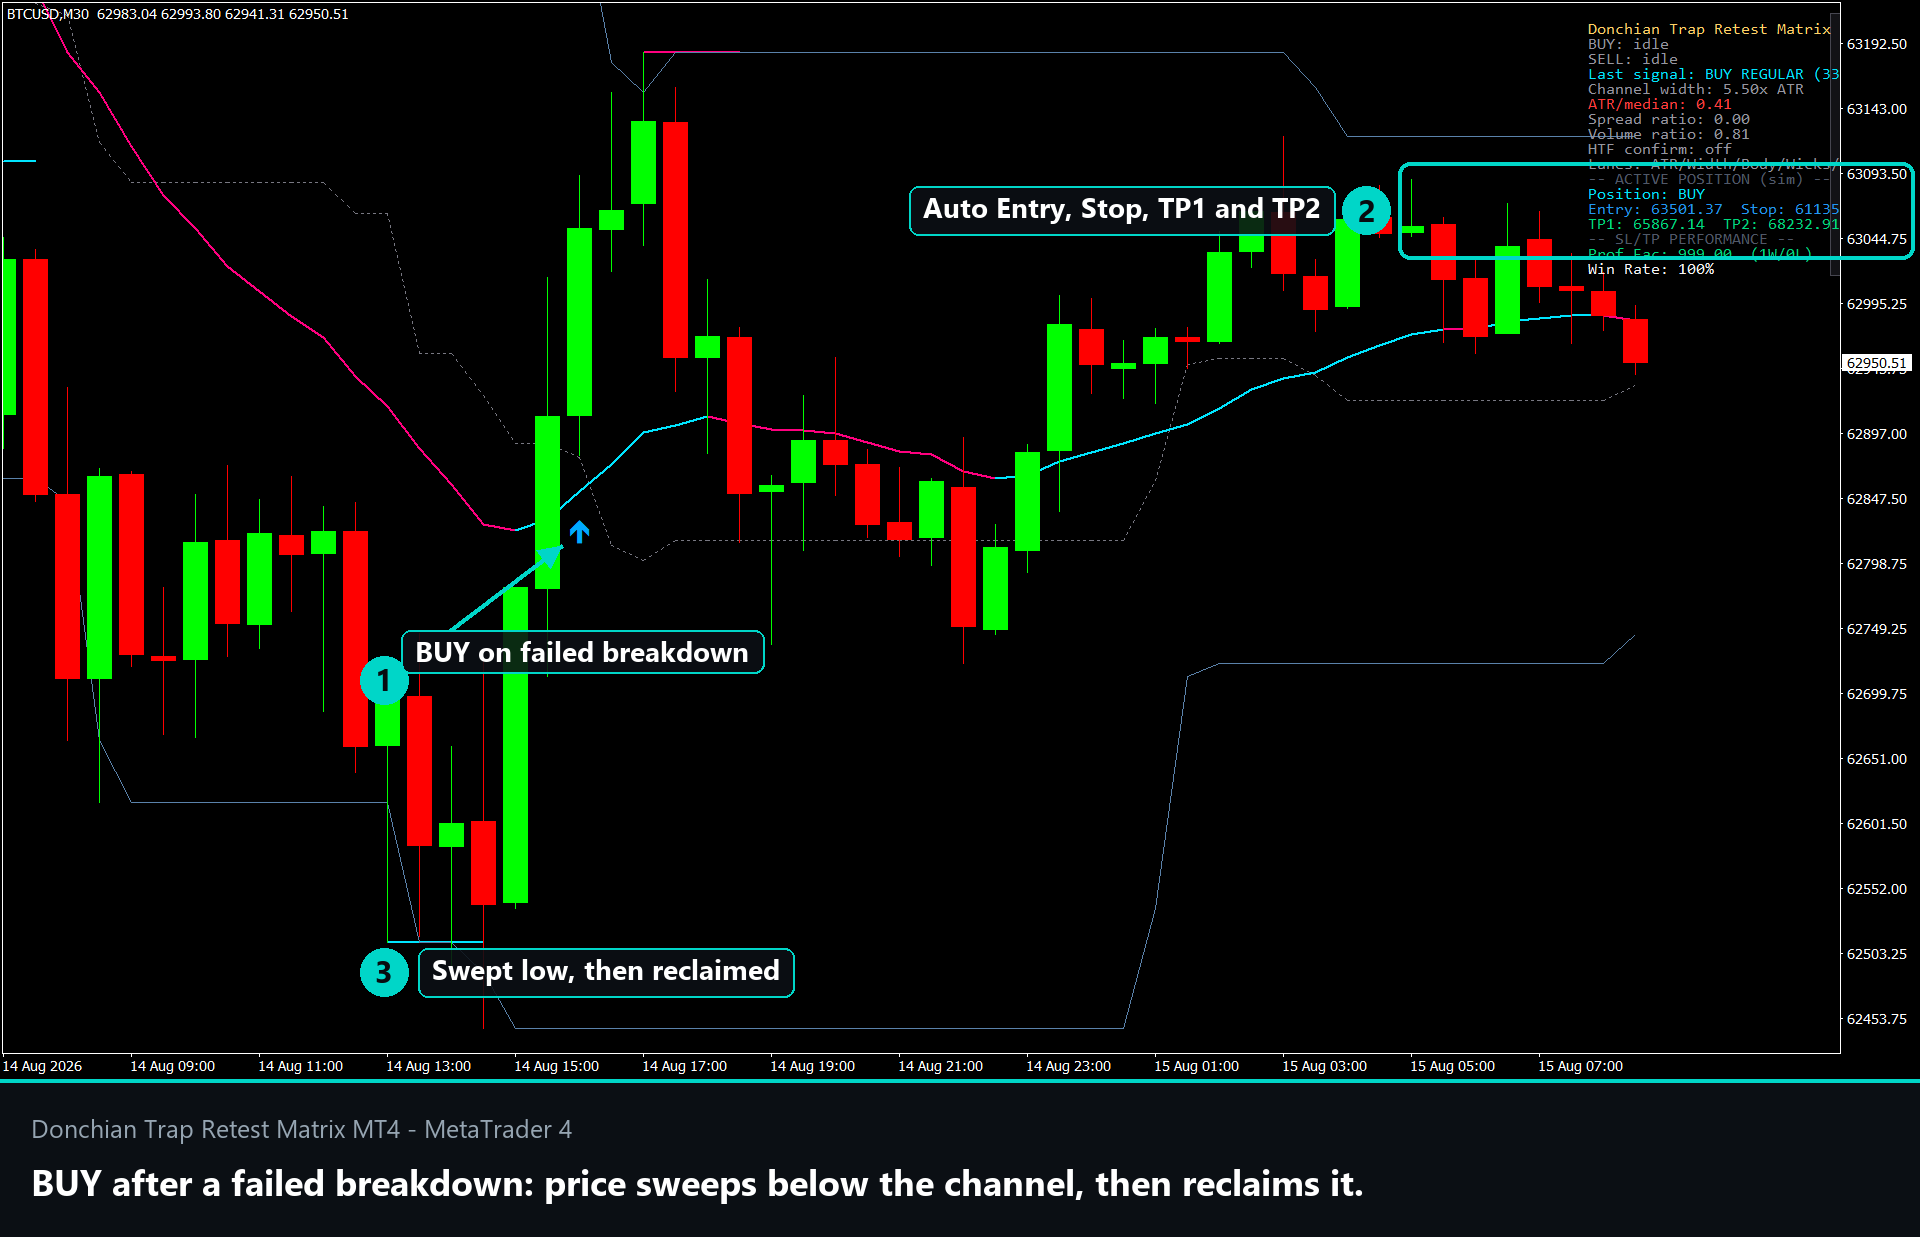
- Sweep - price trades beyond the band by at least 0.15 ATR (SweepATRMin), marking a genuine breach rather than a touch
- Reclaim - a close back inside the band within 1-3 bars arms the setup
- Trigger - a candle closes beyond the reclaim bar's high (low for shorts) while the 20-EMA baseline slopes with the trade
- Strong tier - the trigger wick is at least 55% of range and tick volume is at least 1.2x its 20-bar average
From trap to signal: reading an arrow
Signals confirm on closed bars; a live-bar preview may be dashed but does not alert until close.
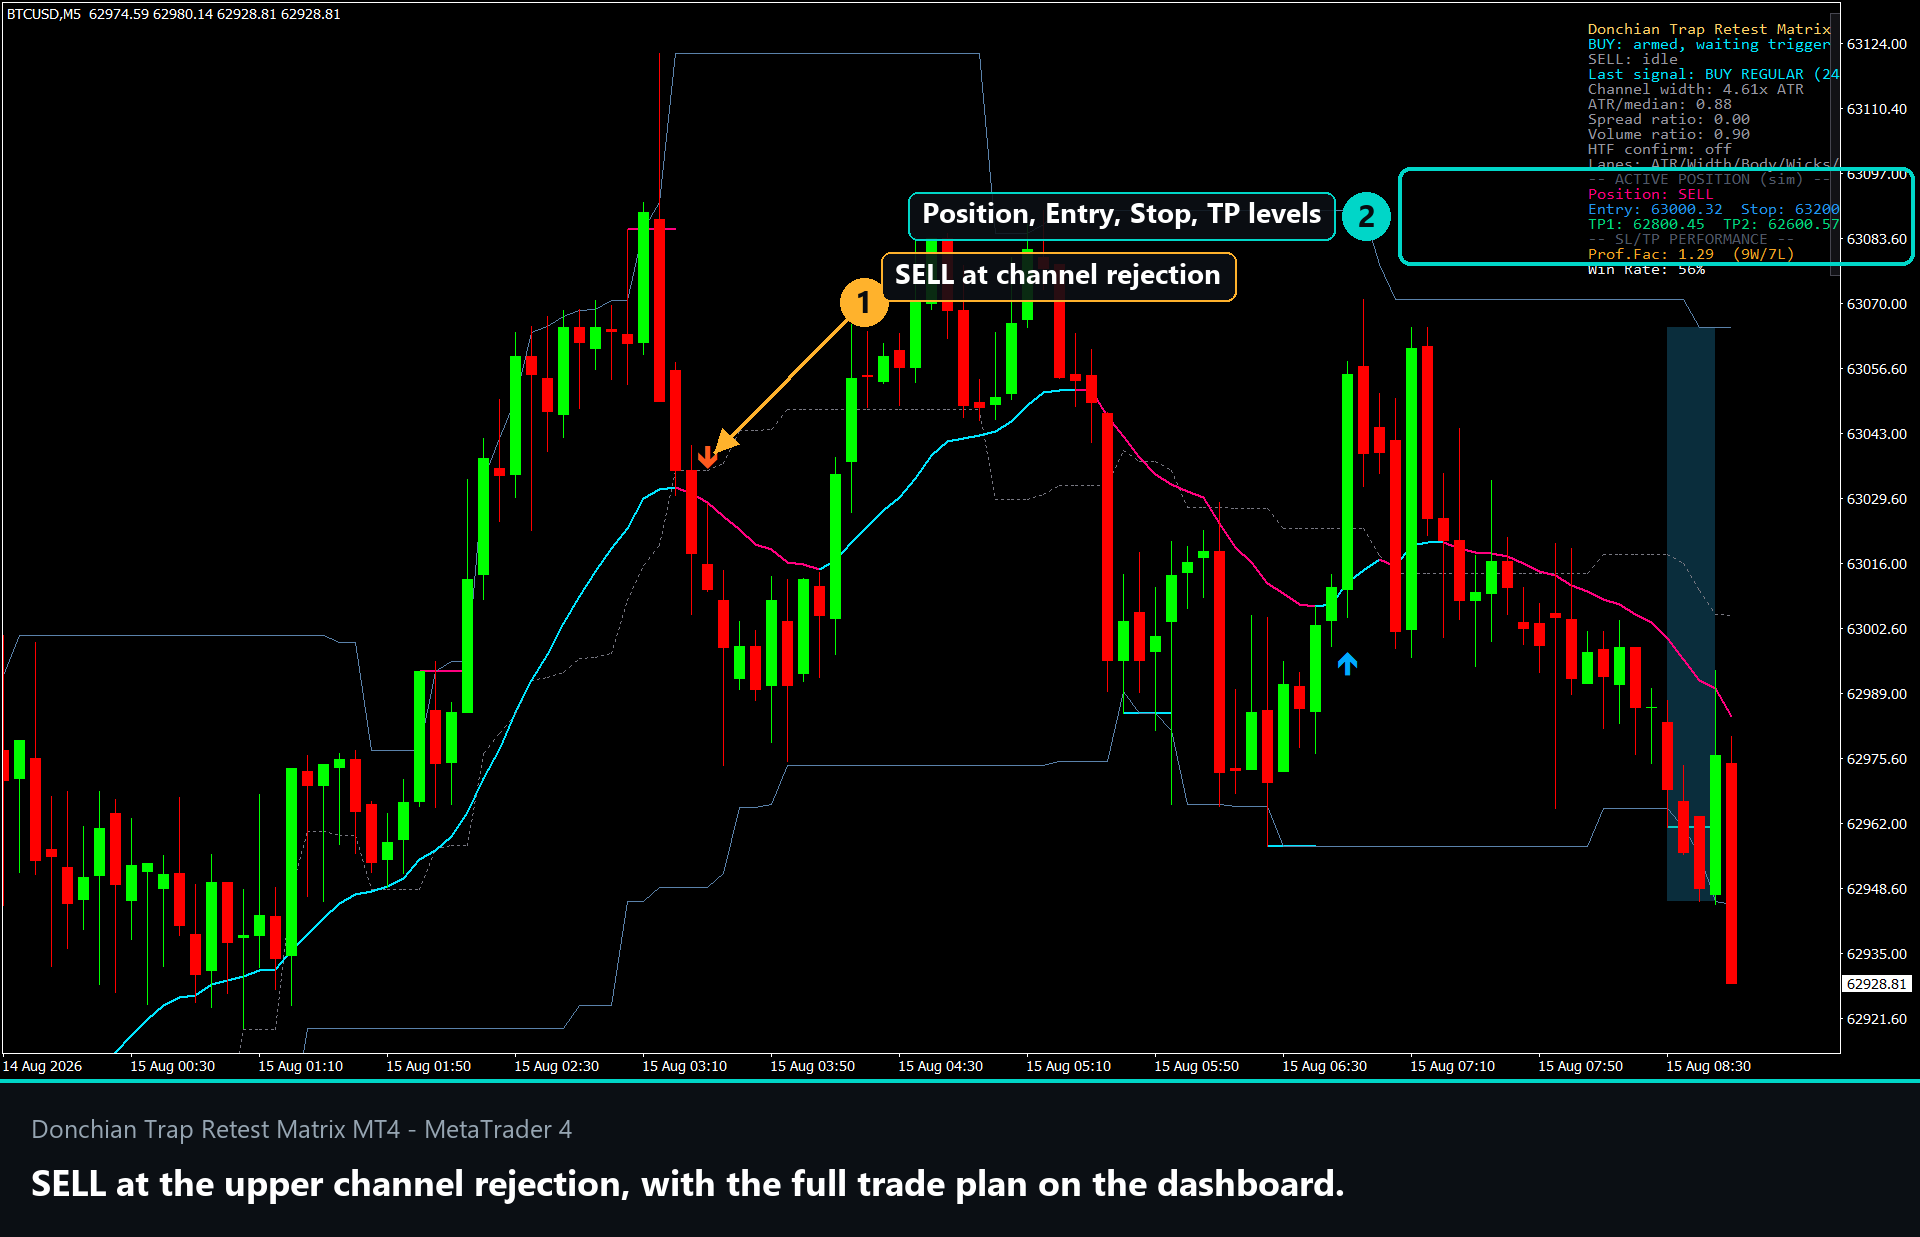
A BUY prints when:
- Price pierced the Donchian lower band by at least 0.15 ATR and closed back above it within the reclaim window
- A trigger candle closes above the reclaim bar high with close above a rising 20-EMA baseline
- ATR, spread, body-size and channel-width filters allow the bar; the strong tier adds the wick and volume conditions
A SELL is the mirror image: a failed breach above the upper band, a reclaim close back below, then a trigger below the reclaim bar low with a falling EMA baseline and the same filters.
What appears on the chart:
- Upper and lower bands, shaded channel, midline and a green/red/gray EMA ribbon, plus armed trap zones and failed-break markers
- A BUY or SELL arrow with entry at the trigger close, a stop beyond the failed sweep extreme plus 0.25 ATR, TP1 at 1R and TP2 at the opposite Donchian side, with an optional EMA20-plus-ATR trail
- Alerts for setup armed, regular and strong triggers, TP/SL zone touches and opposite trap invalidation
Is Donchian Trap Retest Matrix right for you?
It fits you if:
- You trade intraday gold, indices or forex majors and keep getting trapped by late breakouts
- You would rather enter the first retest after a failed break than the break itself
- You want the trap, the levels and the risk drawn for you
- You are comfortable with an active tool on M5 to M30
It fits you less well in choppy ranges, which can produce repeated small fakeout signals, and during real news expansion, when a breach becomes a genuine breakout - which is why the ATR and spread filters matter. Tick volume is broker-dependent, and this does not claim guaranteed fakeout detection.
Installing it: copy the .ex4 file into the MQL4/Indicators folder inside your terminal's data folder, refresh the Navigator panel in MetaTrader 4, then drag Donchian Trap Retest Matrix onto the chart. Every threshold above is editable in the Inputs tab.
-> Browse the ZynAlgo marketplace
This indicator is provided for educational purposes only and does not constitute financial advice. Trading involves risk; past performance does not guarantee future results.
- v1Jul 22, 2026
Initial release

Why breakout entries get trapped and how to trade the failed move instead
You chase a candle beyond the Donchian band and two bars later you are stopped out. This article explains the failed-breakout trap and how one MT4 indicator waits for the reclaim before it signals.

Why your Donchian breakout entries keep reversing on you
Price breaks the channel, you enter the next bar, and it reverses. You are not late, you are trading the wrong side of the trap. This shows you how to identify when a Donchian breach has already failed and signal the retest instead.