Big Figure Trap Signals
Round numbers are where stops sit, which is exactly why price is dragged through them and then dragged straight back. Big Figure Trap Signals prices that sequence: it ignores the sweep and waits for the reclaim.
Key benefits
- Sweep, then reclaim - the level has to be taken out by a set distance and given back on the same closed candle, so a clean break through is never marked
- Rejection has to be visible - the candle must leave a wick of its own, and close past the level and past its own midpoint
- Two tiers by wick quality - a bigger arrow for the premium tier, the same arrow smaller for the regular tier, never a different colour
How it works
The indicator builds a grid of big, half and quarter levels from the symbol's own digits. A candle that trades beyond the nearest level by the sweep distance, then closes back with a long enough reclaim wick and an acceptable range, prints the signal. Full rule set is in the Manual.
What's included
MetaTrader 4 indicator file (.ex4), with level grid, sweep, wick, range, volume, session and risk settings open in the Inputs tab.
Best for
Intraday traders on gold, FX majors and indices, M5 to H1, who already trade stop-hunt reversals around round numbers and want the criteria fixed instead of eyeballed.
Get started
-> Browse the ZynAlgo marketplace
Trading involves risk. This indicator is an analysis tool for educational purposes and does not guarantee results.
Big Figure Trap Signals
Why the sweep is not the signal
Big Figure Trap Signals is a round-number reversal indicator for MetaTrader 4. It exists for one sequence: price runs past a psychological level, takes the orders sitting behind it, and then closes back on the side it came from. The run through is the bait; only the return is marked.
Every closed candle is measured against:
- Location - the distance from the nearest level on an auto-built grid of big, half and quarter figures
- Sweep - whether the candle actually traded beyond that level by the sweep distance, not merely touched it
- Reclaim - whether the close came back past the level and past the candle's own midpoint
- Rejection - the wick left on the swept side, as a share of the whole candle range
- Context - the candle range against ATR, the spacing of the surrounding levels, and optional volume, spread, session and Friday-close filters
What lands on your MetaTrader 4 chart is the level grid itself, the signal arrows, a measured trade box, and a separate logic window carrying the distance to the nearest level, the candle range and the reclaim wick ratio as their own lines.
How the level grid is built and swept
The grid is not typed in by hand. It is derived from the symbol so the same settings work across instruments with very different prices.
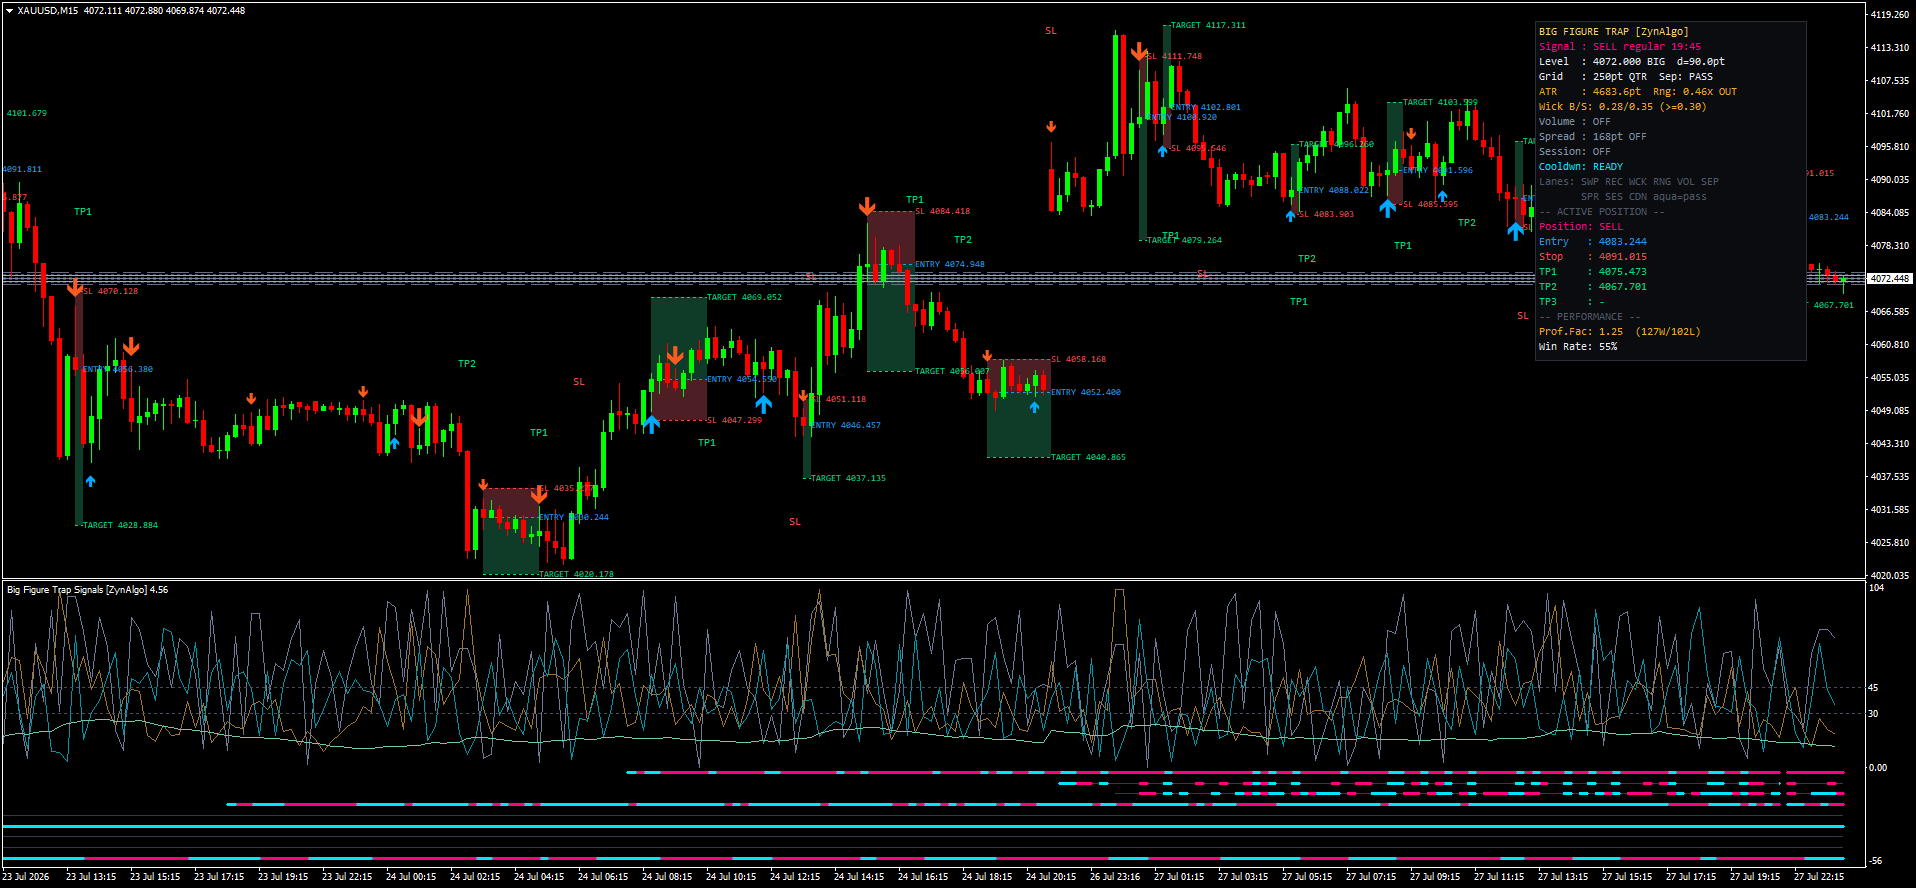
- The big-figure step comes from the symbol's own digits, and half and quarter levels are switched on by default, so the working unit is a quarter of the big step
- The panel names the level in play, its class and how far price sits from it - for example "Level : 4102.50 QTR d=58.0pt"
- The panel also prints the grid spacing and a separation check: if the levels sit closer together than 1.2 times the sweep distance, price would be permanently trapped between two of them, and signals are blocked
A common way to lose money at round numbers is to fade the level itself. That is not what this indicator marks. Until price has gone through the level by the sweep distance, there is nothing to reclaim, and no arrow can appear.
What the trigger actually requires
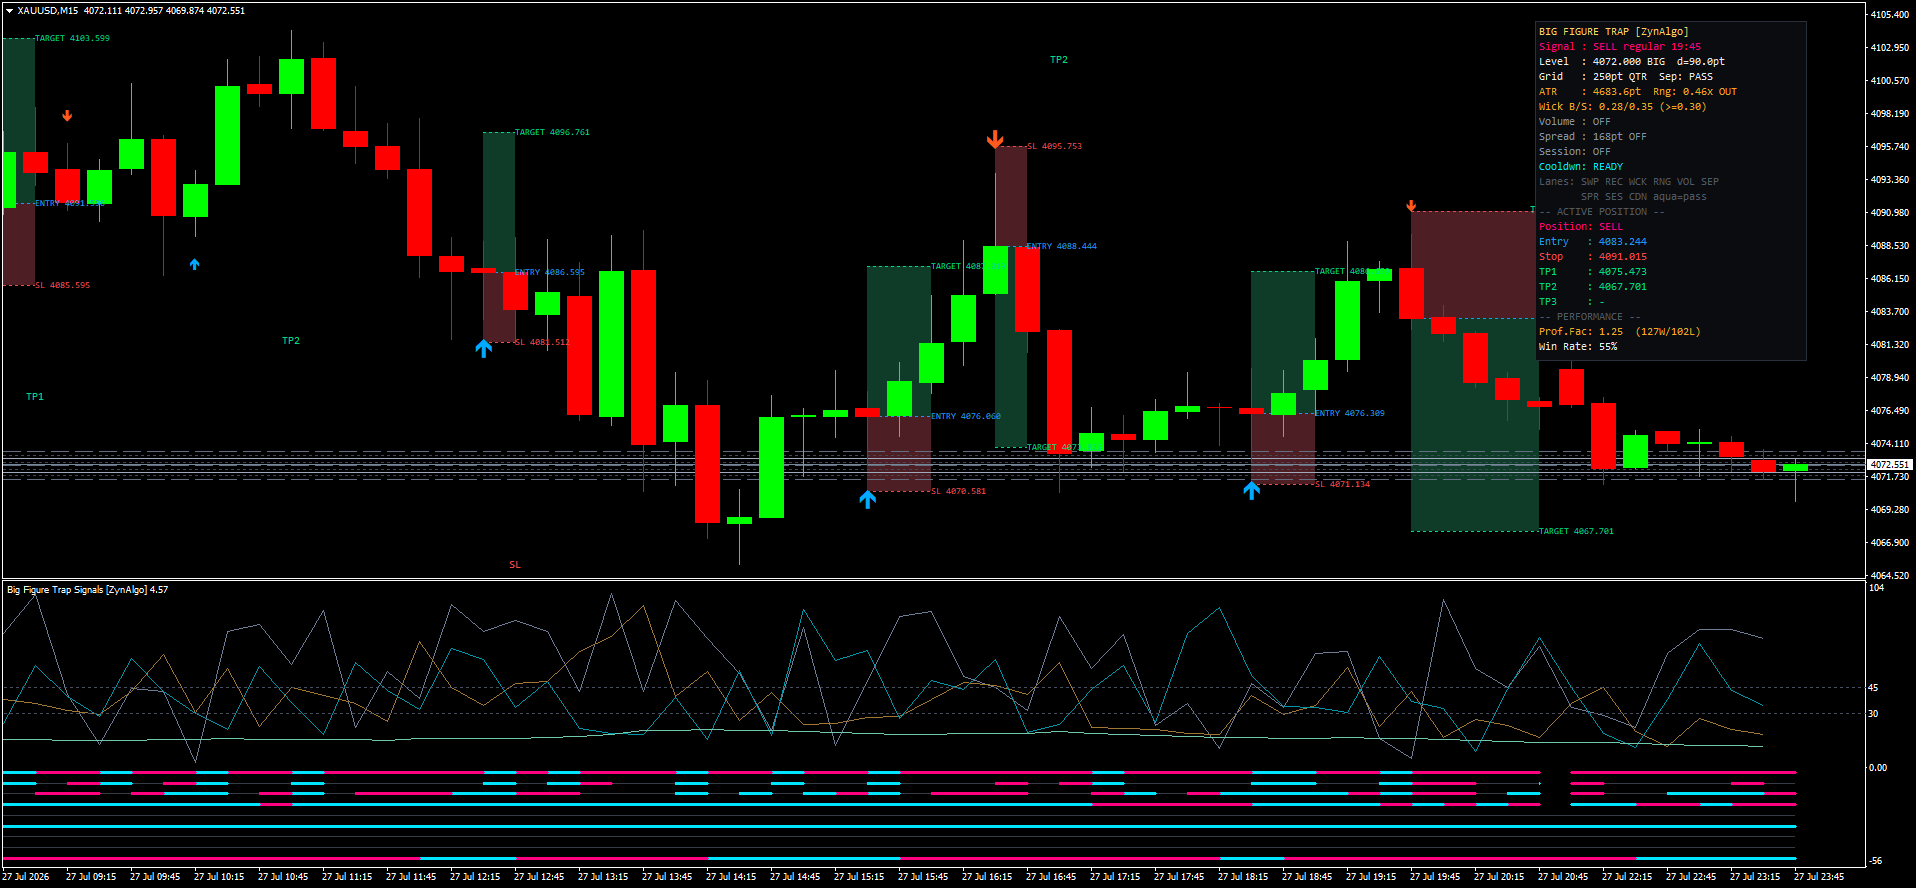
- Sweep - the candle low must trade at least 50 points below the level for a BUY, or the high at least 50 points above it for a SELL
- Reclaim - the same candle must close back past the level and past its own midpoint
- Wick - the rejection wick on the swept side must be at least 30 percent of the candle range for the regular tier, or 45 percent for the premium tier. The panel shows both sides live as "Wick B/S: 0.27/0.11"
- Range - the candle must span between 0.6 and 2.5 times ATR(14), so neither a dead bar nor a runaway one qualifies
- Cooldown - after a signal, the same direction is muted for 6 bars
Reading a signal on the chart
The whole sequence resolves on one closed candle. There is no arming state to track and nothing carries over to the next bar.
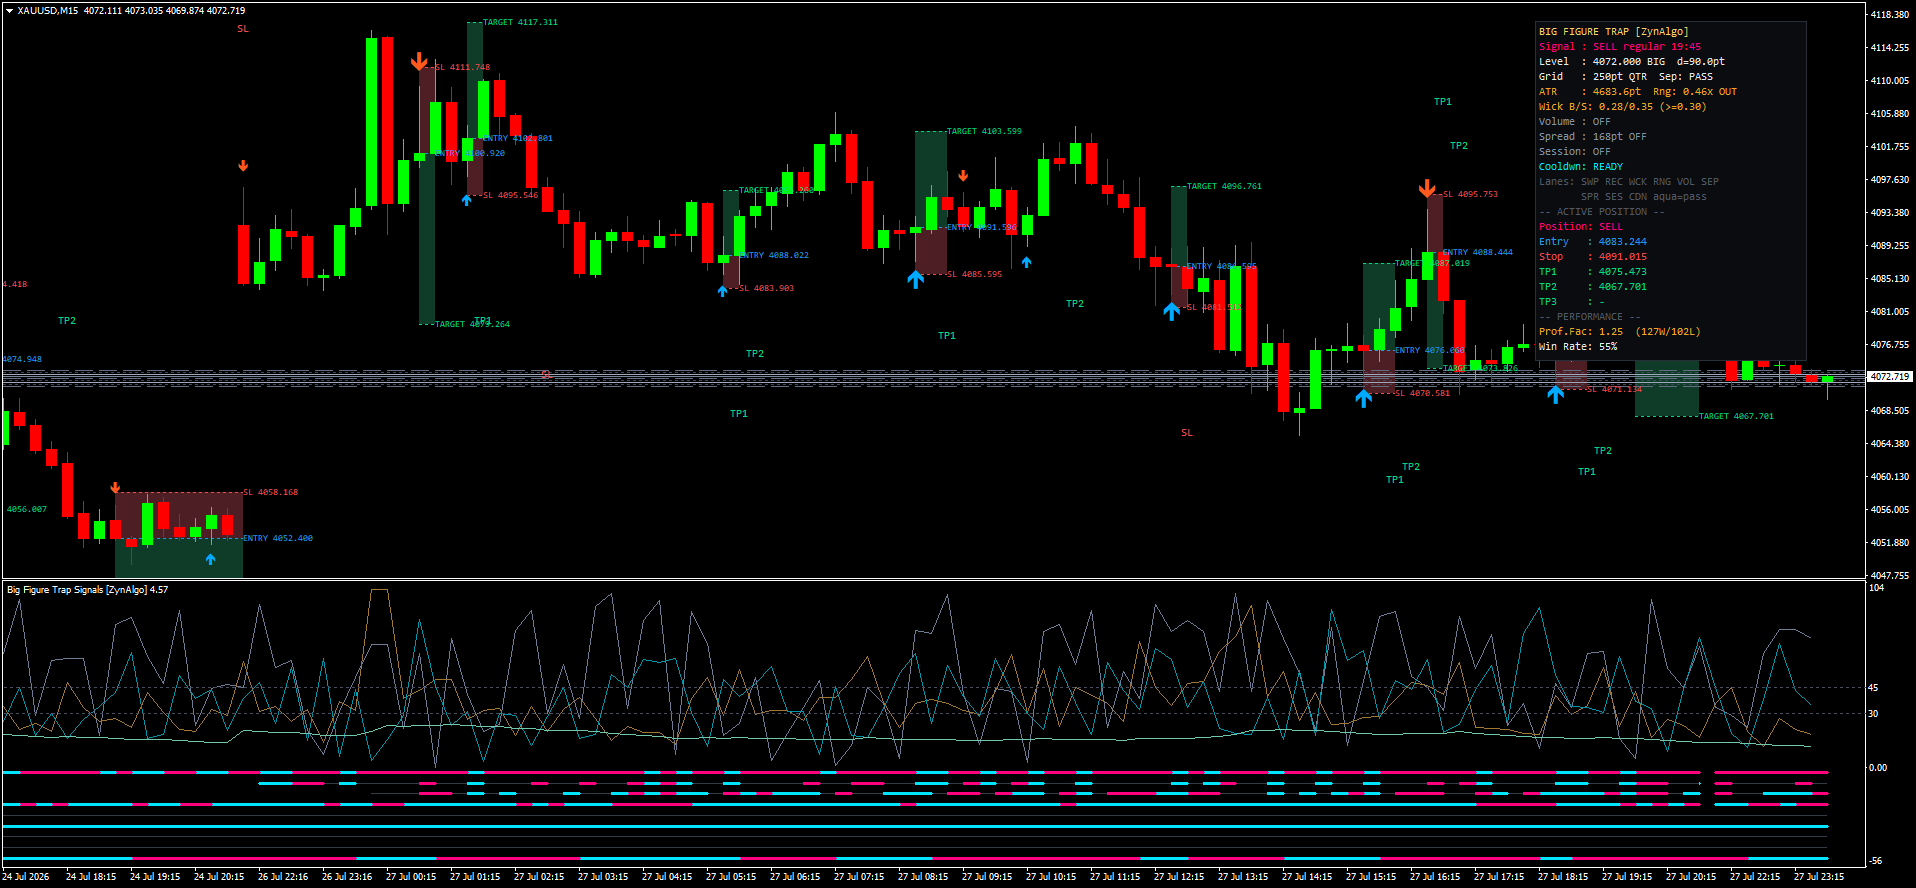
A BUY prints when price sweeps below the nearest level, closes back above it and above its own midpoint, with a lower wick clearing the ratio, a valid range, adequate level spacing and a clear cooldown. A SELL is the mirror image above the level.
What appears on the chart:
- An arrow below the candle for BUY and above it for SELL, offset by 0.30 ATR. Tier is expressed only through size - the premium arrow is larger, never a different colour
- A trade box with ENTRY, SL and TARGET labels: entry at the signal candle close, stop beyond the swept extreme plus 0.25 ATR of buffer, then targets at 1R and 2R by default, with 3R available
- A status panel naming the last signal and its tier, the level in play, every gate above, the live simulated position, and the running Profit Factor and Win Rate of the signals on that chart
- Result markers where a target or stop was reached, so the outcome of a past signal can be read without scrolling the panel
Note that the indicator marks the chart rather than sending pop-up alerts. That is deliberate: the panel carries the state, and the gates are meant to be read before the arrow, not after it.
Who gets the most out of this indicator
It suits you if:
- You already trade liquidity sweeps and stop hunts around round numbers, and want the criteria written down instead of judged by eye
- You prefer a graded signal - premium versus regular - to a single yes or no
- You want the stop anchored to the swept extreme rather than a fixed distance
- You work intraday on instruments where round numbers are watched: gold, FX majors and indices
Working ranges: M5 to H1 suits the default grid on most instruments, with M15 the reference timeframe used in the screenshots above. On symbols with unusual digits or synthetic pricing, check the grid line spacing on the chart before trading it, and set the big-figure step by hand if the auto value does not match the levels you actually watch.
It suits you less if you trade breakouts. A genuine break that keeps running is exactly the case this indicator is built to stay silent through, and during a strong trend it will sit quiet for long stretches.
Installing it: copy the .ex4 file into the MQL4/Indicators folder inside your terminal data folder, refresh the Navigator panel in MetaTrader 4, then drag Big Figure Trap Signals onto a chart. If you were issued an Access Key, paste it into the Access Key input. Every threshold above is editable in the Inputs tab.
-> Browse the ZynAlgo marketplace
This indicator is provided for educational purposes only and is not financial advice. Trading involves risk; past performance and backtested behaviour do not guarantee future results.
- v1Jul 22, 2026
Initial release

Why Round-Number Reversals Fail Without a Sweep and Close Confirmation
Fading a psychological level the moment price touches it is a common way to lose money. Big Figure Trap Signals waits for the sweep through, the reclaim and the rejection wick before marking a reversal on MetaTrader 4.

Why Stop Hunts at Round Numbers Keep Reversing After the Sweep
Price runs past a psychological level, grabs the stops, then closes back on the side it came from. This indicator marks only the return, not the sweep itself.