ATR Channel Exhaustion Snapback
Most reversal tools fade the first touch of a band. ATR Channel Exhaustion Snapback does not: a candle stretching past the channel only puts the setup on watch, and nothing prints until price closes back inside it.
Key benefits
- Arm, then confirm - piercing the channel opens a grace window of a few bars; the signal itself needs a later candle to close back inside
- Two tiers, one rule set - the arrow grows when RSI has also reentered from its extreme and the close reclaims the prior candle or the exhaustion midpoint
- Risk drawn with the signal - entry, a stop beyond the exhaustion wick plus an ATR buffer, and 1R/2R targets appear on the chart together
How it works
An EMA basis plus an ATR multiple builds the volatility channel. A candle with a genuine range that closes beyond it, or wicks past by a set ATR distance, arms the exhaustion state. A BUY or SELL prints when a later closed candle reclaims the channel with acceptable tick volume. Full rule set is in the Manual.
What's included
MetaTrader 4 indicator file (.ex4), with channel, exhaustion, RSI, volume, session and risk settings open in the Inputs tab.
Best for
Intraday traders fading overextension on gold, indices and active FX pairs, M1 to M15, who want the reclaim proven before they take the other side.
Get started
-> Browse the ZynAlgo marketplace
Trading involves risk. This indicator is an analysis tool for educational purposes and does not guarantee results.
ATR Channel Exhaustion Snapback
Why this indicator waits for the reclaim
ATR Channel Exhaustion Snapback is a mean-reversion indicator for MetaTrader 4. It is built around a single distinction: price stretching past its own volatility envelope is not the trade, price coming back inside it is. Everything before the reclaim is treated as a watch state, not a signal.
Every closed candle is measured against:
- Position - where the candle sits against a Keltner-style channel, an EMA basis of 20 with 1.75 times ATR either side
- Range quality - the candle span, which must be at least 0.80 ATR but no more than 3.00 ATR, so dead bars and news spikes are both excluded
- Momentum - RSI(14) against the 30 and 70 levels, used to decide how strong the signal is rather than whether it exists
- Participation - tick volume against its own 20-bar average, with a tolerance of 35 percent below it
- Context filters - optional higher-timeframe EMA bias, trading session, spread cap, and a cooldown between signals in the same direction
What lands on your MetaTrader 4 chart is the channel itself, dots on every bar that armed the state machine, signal arrows, a measured trade box, and a separate logic window carrying RSI, ATR, tick volume, spread and exhaustion depth as their own lines.
What arms the exhaustion window
Nothing fires on the bar that pierces the channel. That bar only opens a window, and the window expires on its own count.
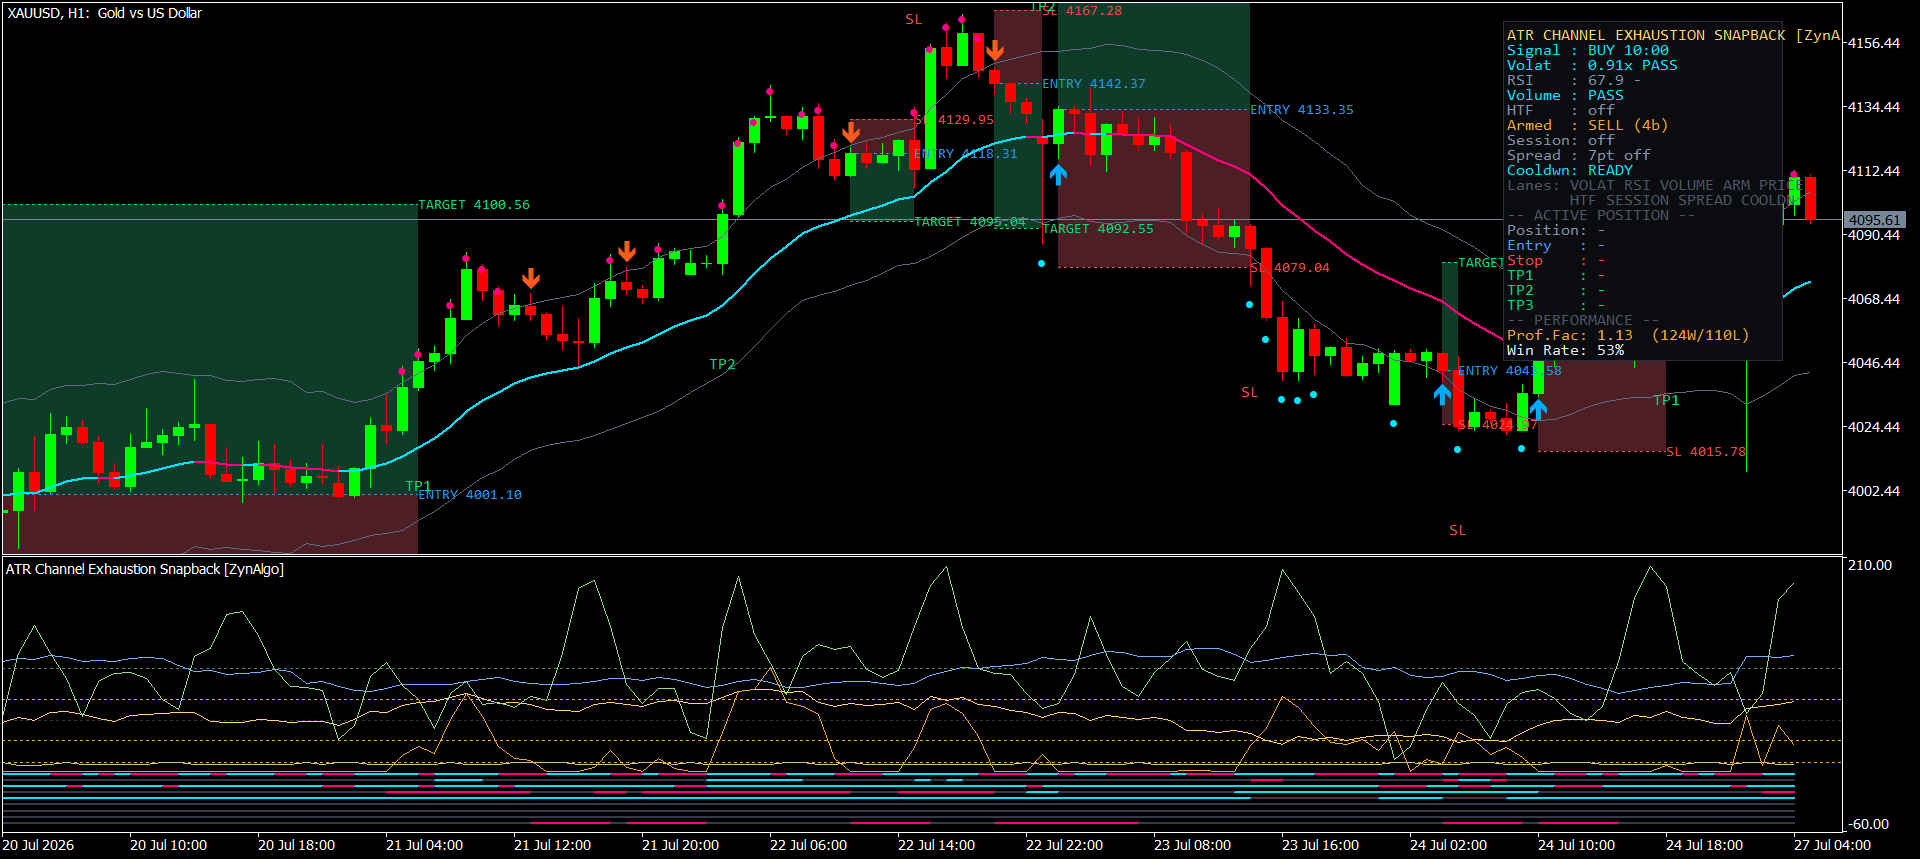
- The window opens when a genuine-range candle closes beyond the channel, or wicks past it by 0.20 ATR
- It stays open for 4 bars by default and then closes with nothing drawn
- The panel prints the live state as "Armed : BUY (4b)" or "Armed : SELL (4b)" with the bars remaining, so you can see what is being tracked before anything is drawn
The mistake this design is built around is selling the first candle that spikes through a band. An overextension is not an edge on its own - plenty of them simply keep going. Requiring the reclaim means the trade you take is one price has already argued against continuing.
How the gates are defined
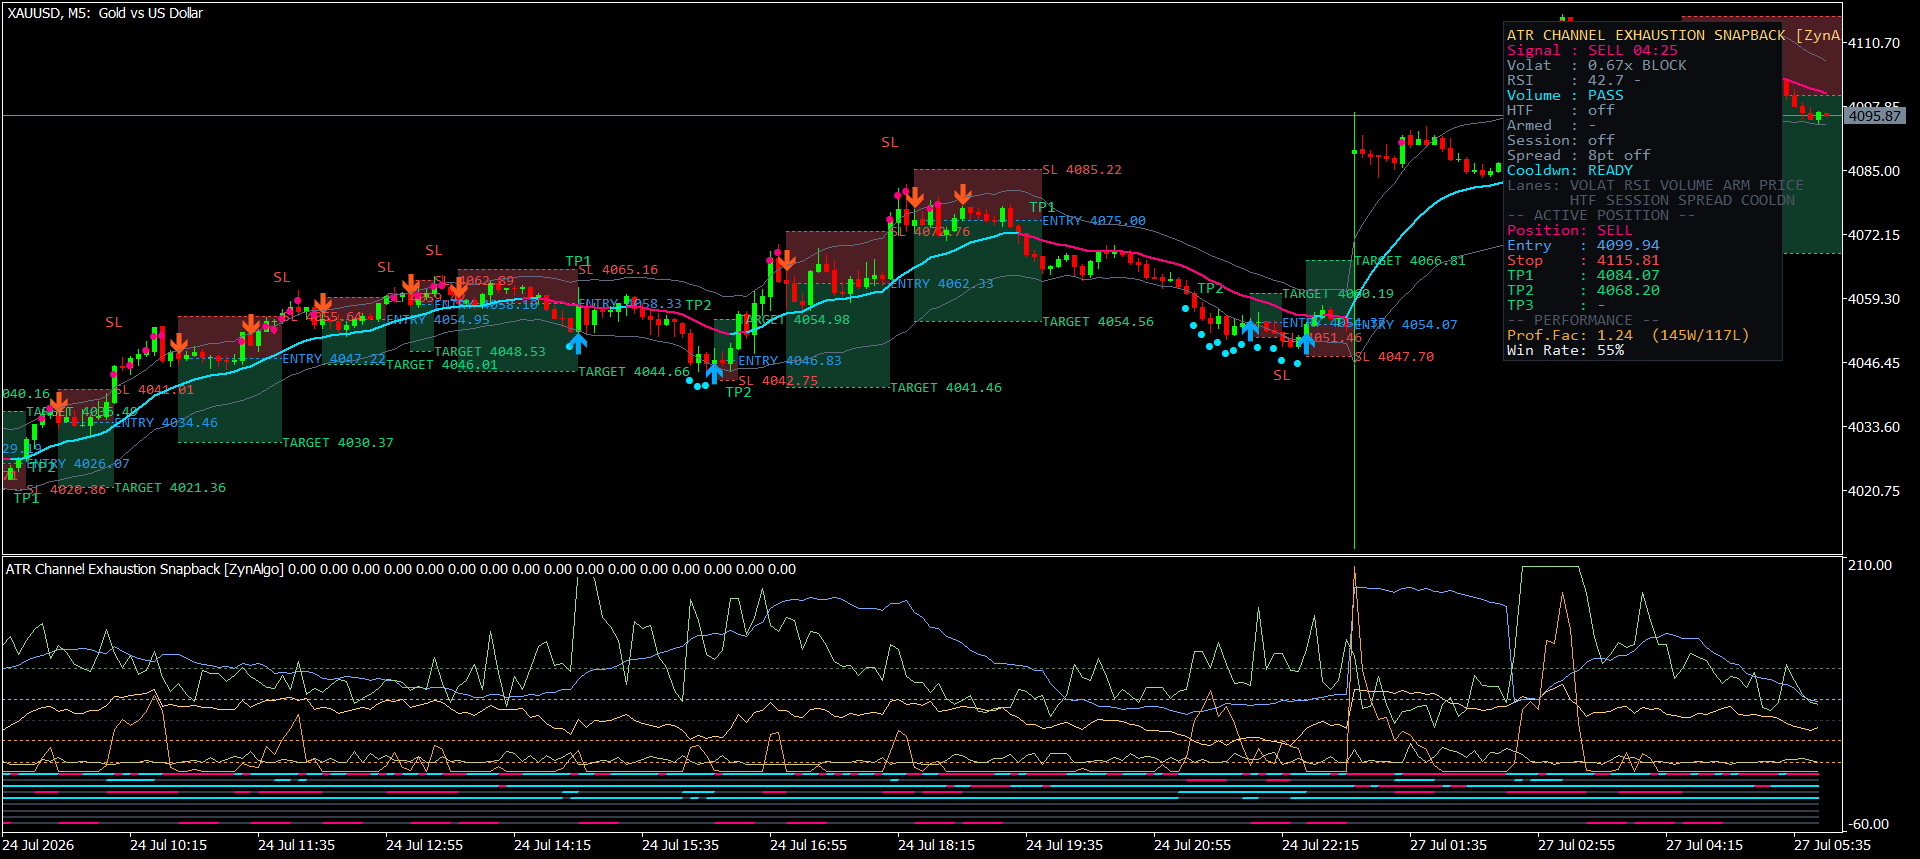
- Channel - an EMA(20) basis with an ATR(20) band 1.75 wide either side. The basis is coloured by its own slope, so the chart is never blank between signals
- Exhaustion - the pierce depth beyond the band in ATR multiples, plotted as its own line in the logic window with a guide line at the threshold
- Range quality - the panel prints "Volat : 0.91x PASS" or "0.67x BLOCK", the candle range as a multiple of ATR against the 0.80 minimum
- Volume - the confirming bar must not sit more than 35 percent below its own 20-bar tick-volume average; the panel reads PASS or WEAK
- Cooldown - after a signal, the same direction is muted for 5 bars, shown as "Cooldwn: 3b left" or READY
From armed to fired: reading a signal
Signals are evaluated on closed candles only, never on the candle still forming, and never on the same bar that armed the window.
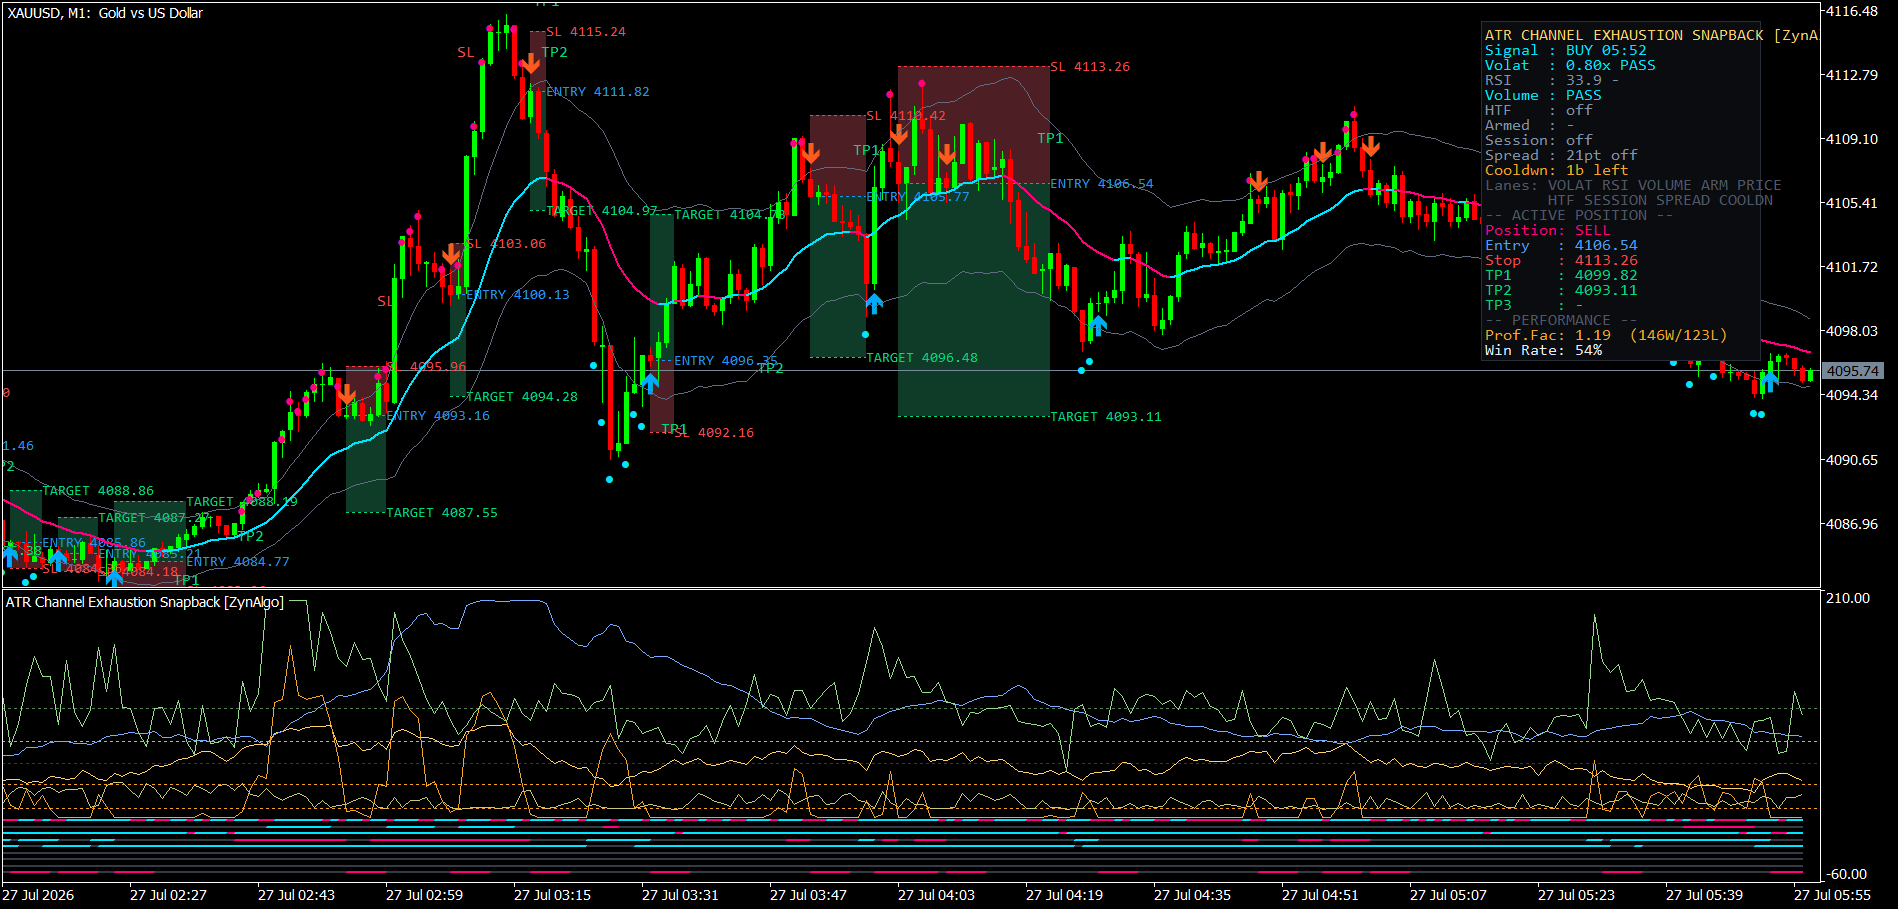
A BUY prints when:
- The bullish window is still open, at least one bar after the arm bar
- The candle closes back above the lower channel band
- Tick volume clears the weak-volume tolerance
- The cooldown is clear, and the session and spread filters allow the bar
A SELL is the mirror image: an open bearish window after a pierce above the upper band, a close back below it, and the same volume, cooldown, session and spread gates.
What appears on the chart:
- An arrow below the candle for BUY and above it for SELL, offset by 0.30 ATR. The arrow is drawn larger when the signal also carries the strong tier - RSI reentering from its extreme plus a close reclaiming the prior candle high or the exhaustion bar midpoint
- A small dot on each bar that armed the window, so you can trace the sequence backwards
- A trade box with ENTRY, SL and TARGET labels: entry at the signal candle close, stop beyond the exhaustion wick plus 0.5 ATR of buffer, then targets at 1R and 2R by default, with 3R available
- A status panel naming the last signal and its time, every gate above, the live simulated position, and the running Profit Factor and Win Rate of the signals on that chart
Note that the indicator marks the chart rather than sending pop-up alerts. That is deliberate: the panel is the state, and it is meant to be read rather than reacted to.
Who gets the most out of this indicator
It suits you if:
- You fade overextension, but only once price has argued against continuation
- You want the stop placed by the setup itself rather than a fixed distance
- You are comfortable reading a separate logic pane where RSI, ATR, tick volume, spread and exhaustion depth each have their own line
- You work fast intraday on volatile instruments
Working ranges from the product spec: XAUUSD M1-M5 - index CFDs M1-M5 - active FX crosses M5-M15. Symbol names for indices differ between brokers, so match the instrument rather than the exact ticker.
It suits you less if you trade trends. A strong directional session can hold price outside the channel bar after bar, and the indicator will keep arming and expiring without printing - that is the trade it makes on your behalf.
Installing it: copy the .ex4 file into the MQL4/Indicators folder inside your terminal data folder, refresh the Navigator panel in MetaTrader 4, then drag ATR Channel Exhaustion Snapback onto a chart. If you were issued an Access Key, paste it into the Access Key input. Every threshold above is editable in the Inputs tab.
-> Browse the ZynAlgo marketplace
This indicator is provided for educational purposes only and is not financial advice. Trading involves risk; past performance and backtested behaviour do not guarantee future results.
- v1Jul 22, 2026
Initial release

Why Waiting for the Channel Reclaim Filters Out False Mean-Reversion Trades
You sold the spike through the band and got run over. This MT4 indicator waits for price to come back inside the channel before signaling, filtering continuation moves from genuine exhaustion.
Why My Mean Reversion Entries Keep Reversing on Me
You sell the spike, the band bounce never comes, and you stop out while price keeps running. This article walks through a reclaim-first logic that waits for price to argue against continuation before signaling the fade.