Delta Proxy Trend Pullback
Order-flow visuals are everywhere, but MetaTrader 4 forex only has tick volume. Delta Proxy Trend Pullback is honest about that: it builds a same-symbol delta proxy from candle direction, wick allocation and tick volume, then signals trend pullbacks where that pressure stops fighting the trend.
Key benefits
- A proxy, clearly labelled - delta is estimated from the chart's own OHLC and tick volume, never sold as a real exchange feed
- Two-tier signals - a regular pullback flip plus a stronger tier when proxy CVD diverges from price, so you can tell an ordinary entry from a high-conviction one
- Risk drawn with the signal - stop beyond the pullback swing plus 0.3 ATR, targets at the prior swing and 1.8R, with an optional EMA34 trail
- Trend-first - an EMA34/EMA89 ribbon defines the trend, and signals only fire on pullbacks into it
How it works
In an EMA-defined uptrend, price pulls back to EMA34 while the delta proxy histogram is negative, then the proxy flips positive and closes above its signal average as price reclaims EMA34 - a BUY. The strong tier adds a proxy-CVD higher low against price. Shorts mirror it. Signals confirm on the closed candle. Full rule set is in the Manual.
What's included
MetaTrader 4 indicator file (.ex4), with EMA lengths, delta signal and median lengths, divergence lookback, ATR and spread filters open in the Inputs tab.
Best for
Intraday trend traders on gold M5-M15, forex majors M15-H1 and indices M1-M15 who buy pullbacks and want a volume-pressure read without pretending to see the order book.
Get access
-> Browse the ZynAlgo marketplace
Trading involves risk. This indicator is an analysis tool for educational purposes and does not guarantee results.
Delta Proxy Trend Pullback
What has to line up before a signal can print
Delta Proxy Trend Pullback is a trend-pullback signal indicator for MetaTrader 4. It is built around one honest idea: real order flow is not available on MT4 forex, so it estimates buying and selling pressure from the chart's own candles and tick volume, and only uses that proxy to time entries into an existing trend.
Every closed candle is measured against:
- Trend - the order and slope of EMA34 and EMA89, and which side of them price is closing on
- Pullback - price pulling back to or through EMA34 while the trend is intact
- Delta proxy - a histogram built from candle direction, wick allocation and tick volume, plus a smoothed proxy CVD line
- Delta flip - the proxy turning back with the trend and closing beyond its 5-bar signal average
- Context filters - EMA separation, ATR, proxy strength and spread
Only when the trend, the pullback and the delta flip agree does a BUY or SELL arrive, complete with stop and targets.
Reading the delta proxy
Most order-flow tools on MT4 imply access to data the platform does not provide. This one is deliberately explicit: the delta is a proxy, and it is labelled that way on the chart.
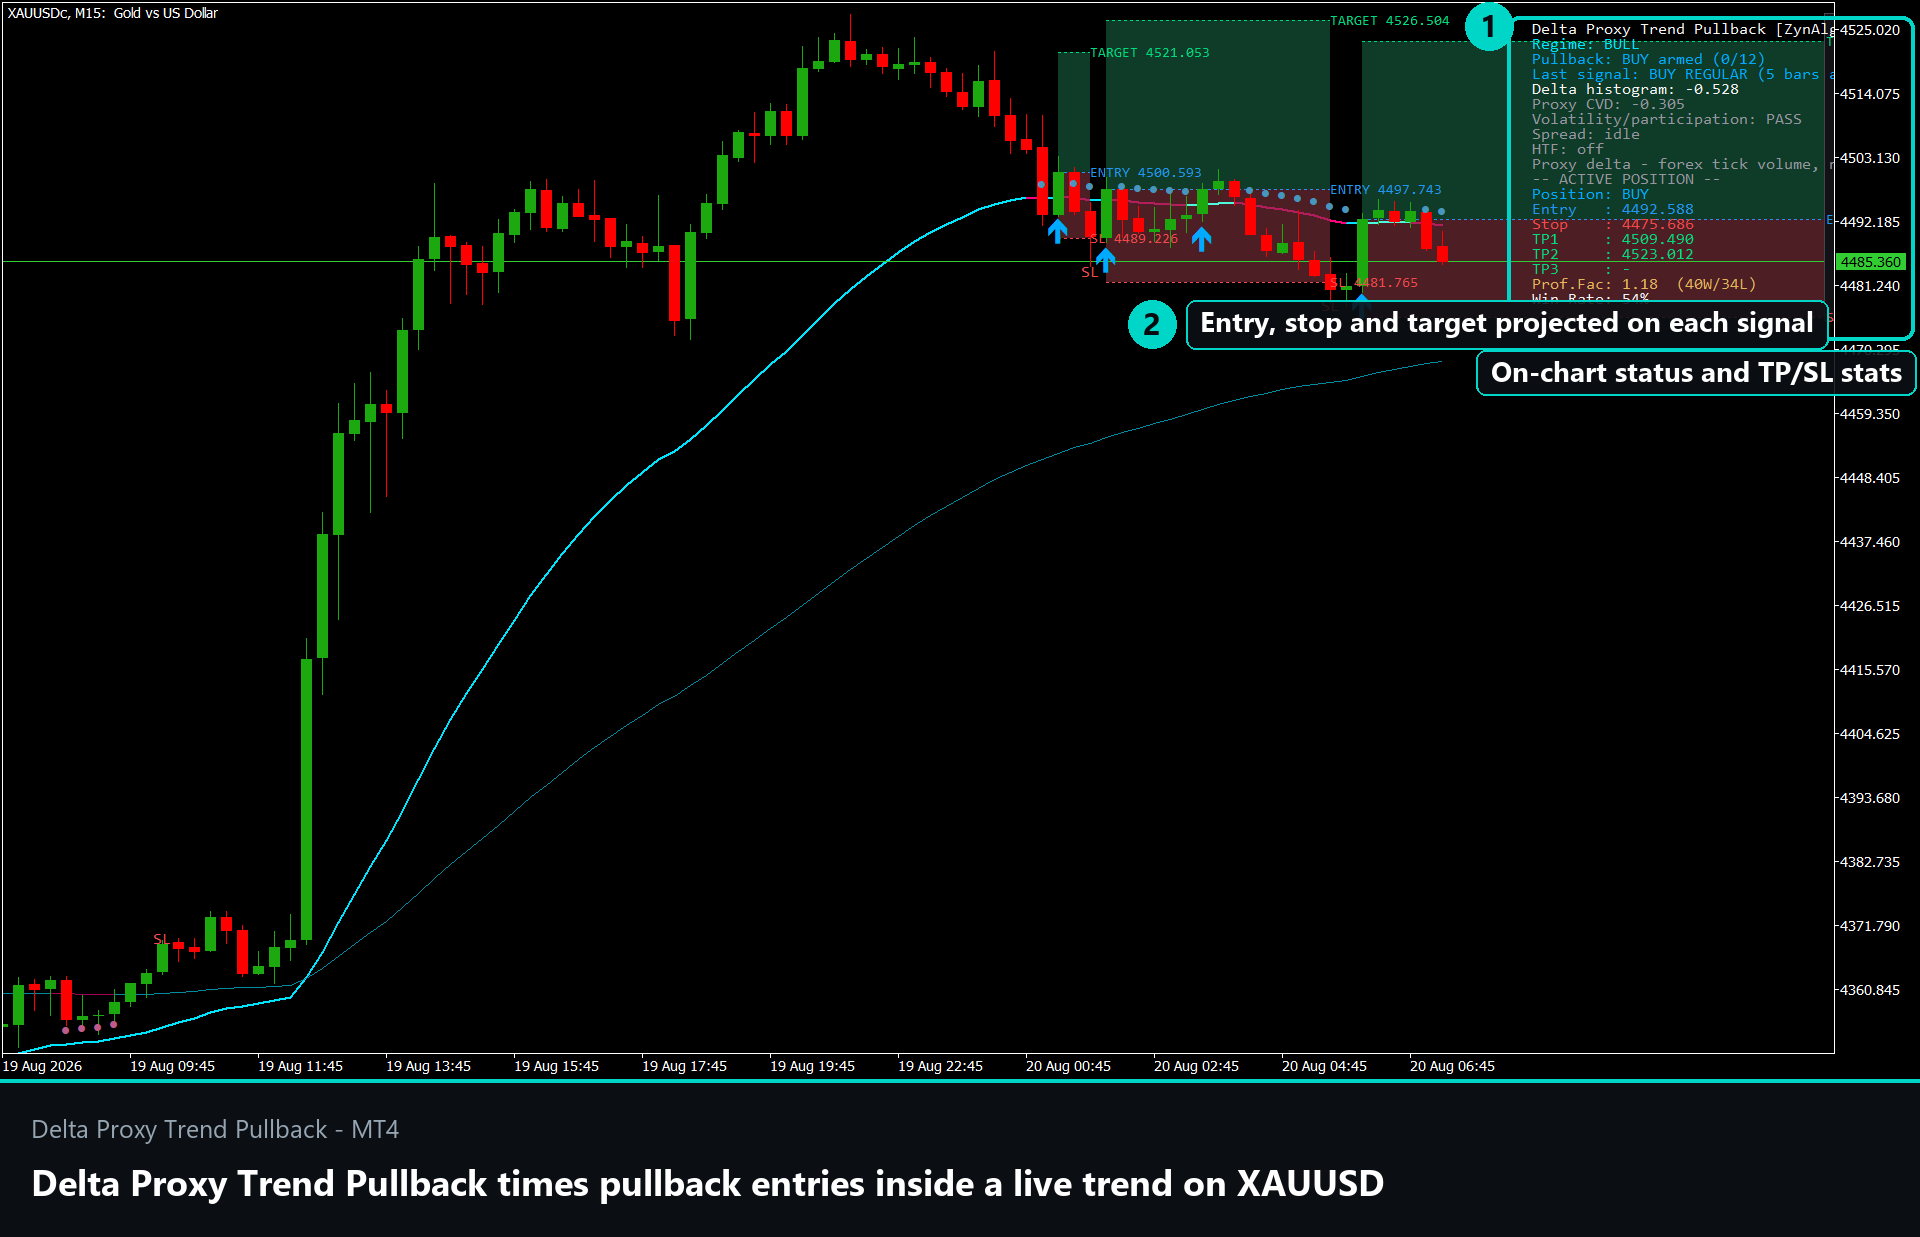
- The histogram estimates per-bar pressure from candle direction, wick placement and tick volume
- The proxy CVD line accumulates that pressure so you can see when it diverges from price
- The mistake this avoids is treating a proxy as a footprint feed - the strong tier exists precisely because a proxy divergence is a hint, not proof
How trend, pullback and flip are defined
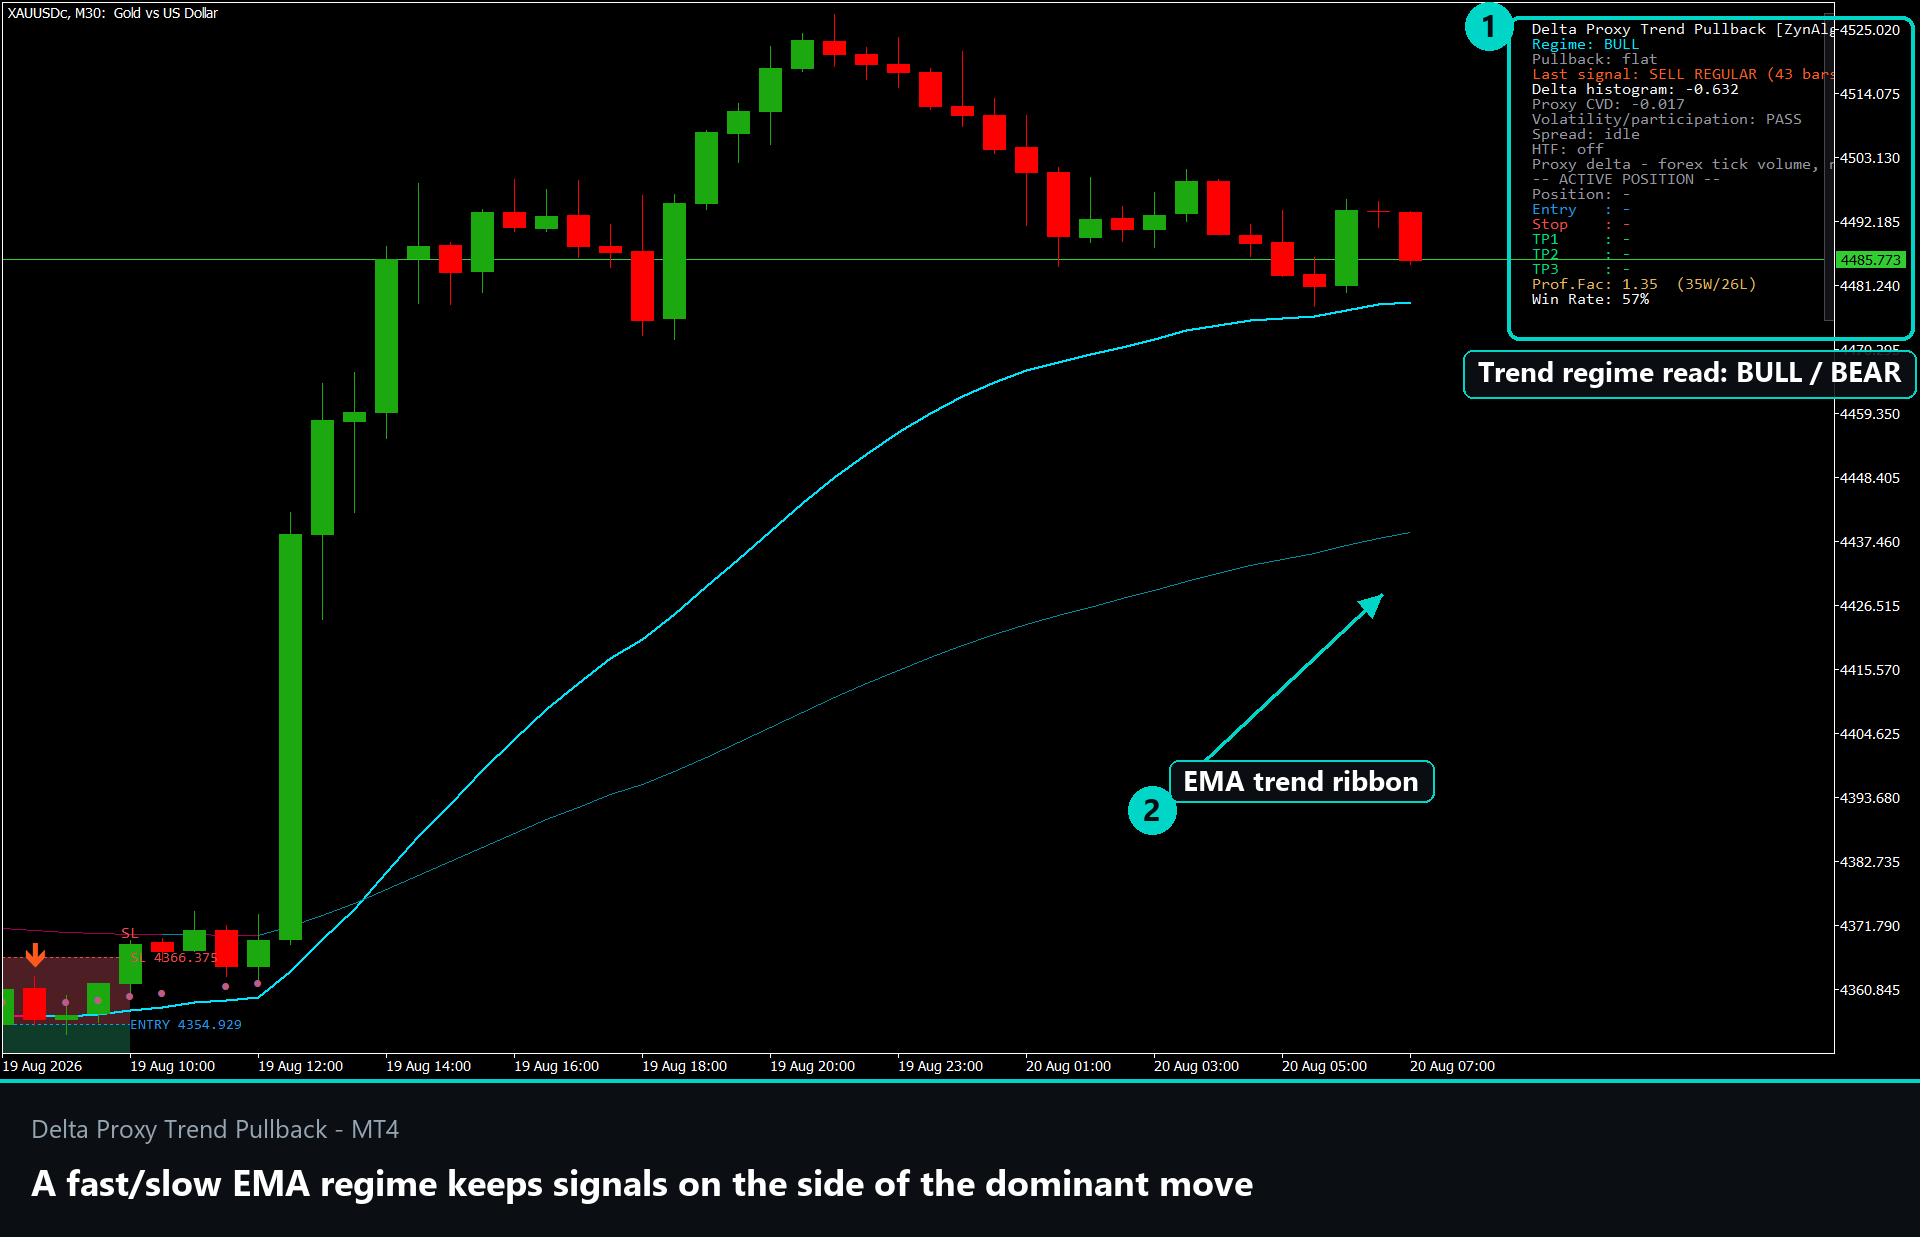
- Trend - EMA34 sloping up with close above EMA89 for longs, or EMA34 sloping down with close below EMA89 for shorts
- Pullback - price trading to or below EMA34 (above for shorts), armed for up to 8 bars
- Delta flip - the proxy histogram negative for at least 2 of the last 4 bars, then turning positive and closing above its 5-bar signal average while price reclaims EMA34
- Strong tier - proxy CVD makes a higher low against an equal or lower price pullback low within 10 bars, showing opposing pressure fading
From pullback to signal: reading an arrow
Signals are evaluated on closed candles only.
A BUY prints when:
- EMA34 slopes up and price is above EMA89
- Price has pulled back to or below EMA34, then closed back above it
- The delta proxy flips positive and closes above its signal average
- EMA separation, ATR, proxy strength and spread filters allow the bar; the strong tier adds a proxy-CVD divergence
A SELL is the mirror image: a down trend, a pullback to EMA34, a proxy flip negative closing below its signal average, and the same filters, with the strong tier adding a proxy-CVD lower high.
What appears on the chart:
- An EMA34/EMA89 trend ribbon, a lower-pane delta proxy histogram, the smoothed CVD line and pullback-armed dots
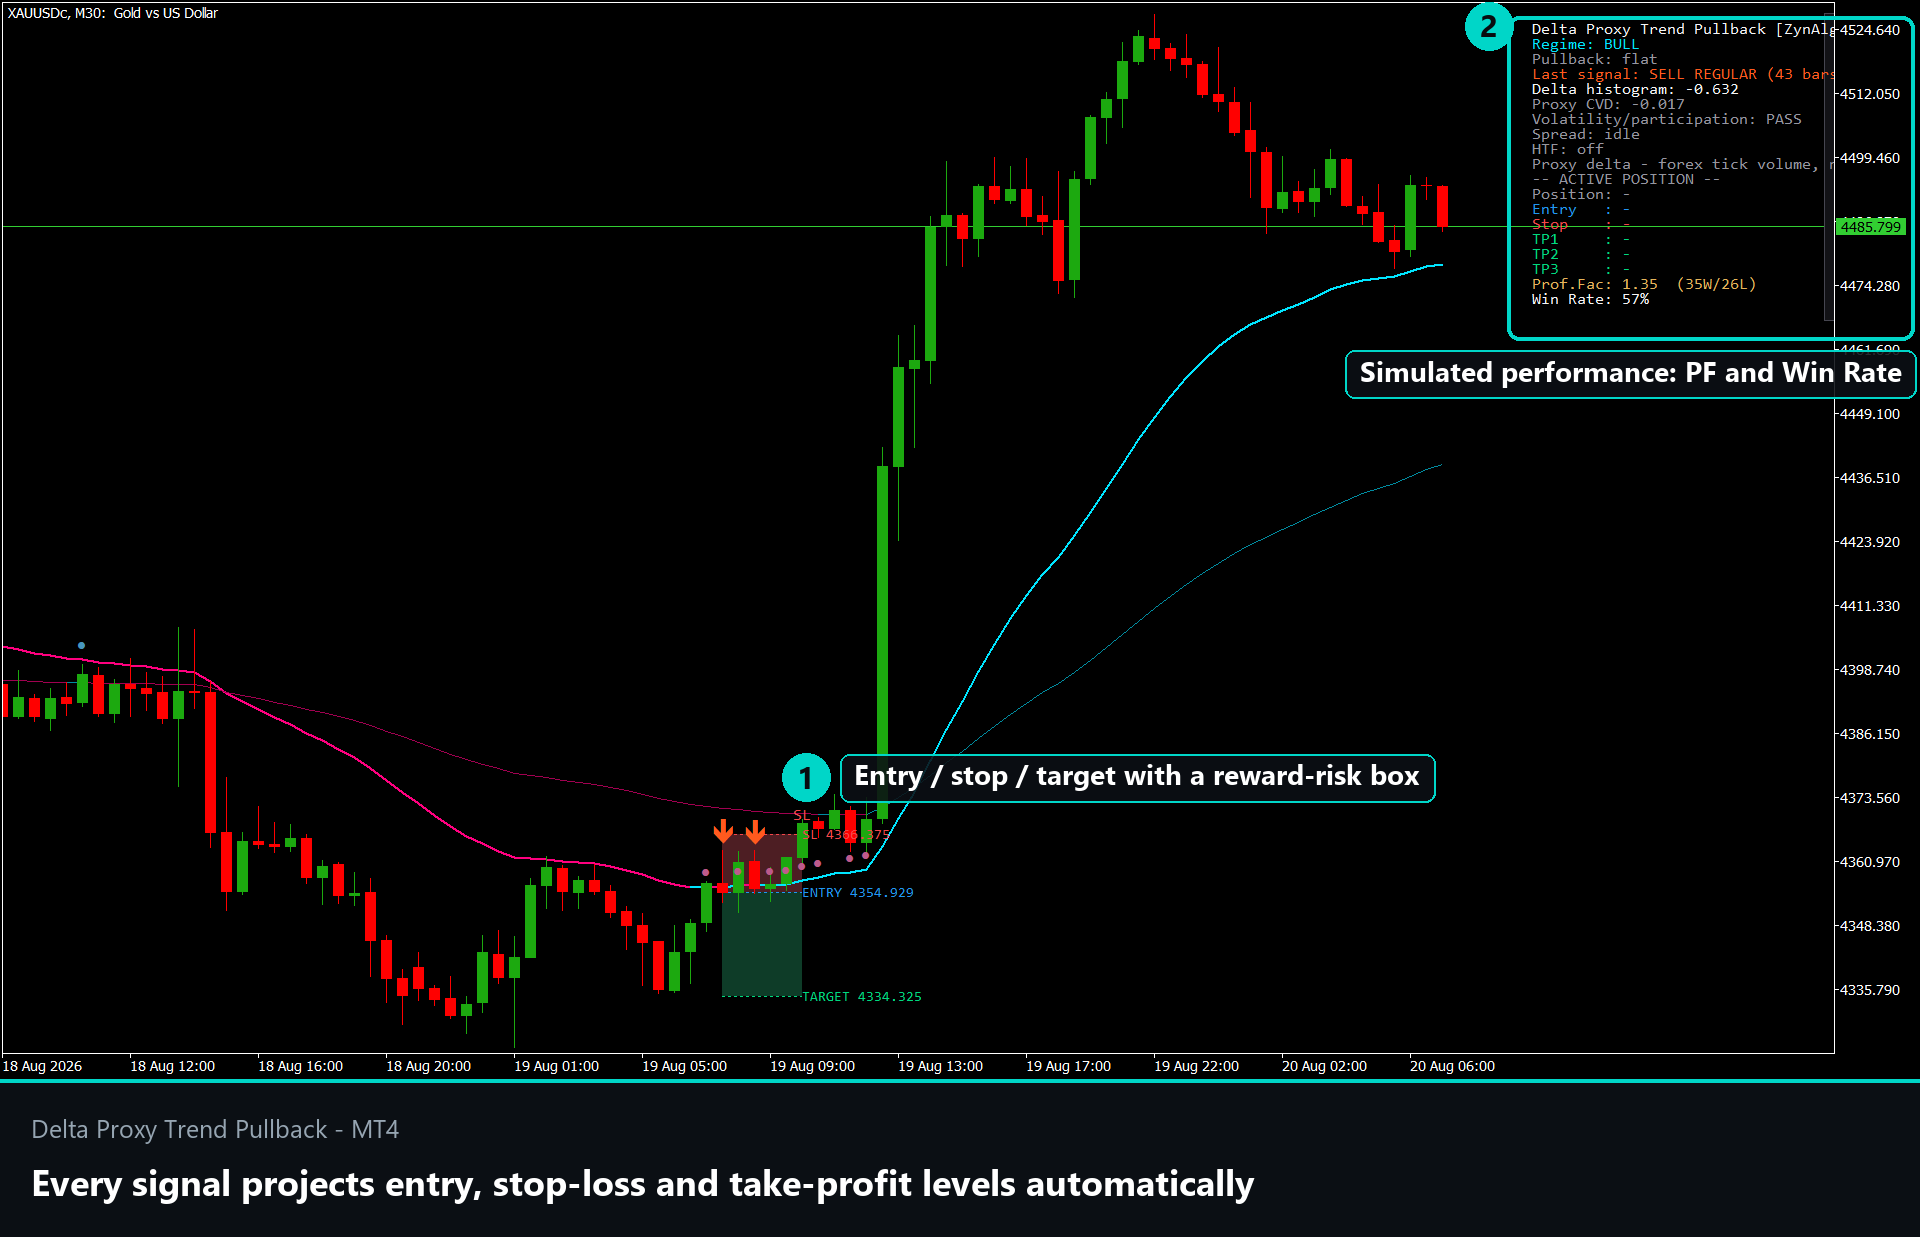
- A BUY or SELL arrow with entry at the signal close, a stop beyond the pullback swing plus 0.3 ATR, TP1 at the prior trend swing, TP2 at 1.8R and an optional EMA34-close trail
- Alerts for pullback armed, delta flip BUY/SELL, strong CVD divergence, trend invalidation and the two-bar delta exit
Is Delta Proxy Trend Pullback right for you?
It fits you if:
- You trade with the trend and buy pullbacks rather than tops and bottoms
- You want a volume-pressure read but refuse to be sold fake order-flow data
- You would rather have the stop and targets attached to the signal
- You work on gold M5-M15, forex majors M15-H1 or indices M1-M15
It fits you less well if you expect true institutional footprint data. Forex tick volume varies by broker and the proxy can diverge from real aggressive volume, so trend and volatility filters are there to keep it selective. This tool does not see institutional orders and makes no such claim.
Installing it: copy the .ex4 file into the MQL4/Indicators folder inside your terminal's data folder, refresh the Navigator panel in MetaTrader 4, then drag Delta Proxy Trend Pullback onto the chart. Every threshold above is editable in the Inputs tab.
-> Browse the ZynAlgo marketplace
This indicator is provided for educational purposes only and does not constitute financial advice. Trading involves risk; past performance does not guarantee future results.
- v1Jul 22, 2026
Initial release