ICT SMC
ICT SMC [ZynAlgo] draws less than the tools it replaces, and that is the point. Only order blocks born from a real structure break reach your chart, and they leave once price has used them.
Key benefits
- Zones that earned their place - each order block must come from a qualified BOS or CHoCH, so weak levels never appear
- A chart that clears itself - a zone is deleted at its 50% mid-line; only three per side stay live
- Structure with a name - BOS, CHoCH and BSL/SSL sweep events are labelled where they happen
- Markers with context - price action arrows print only near a zone, swing or failed break, never twice in 8 bars
- Tuned to your timeframe - swing length, OB strictness and zone count are yours to set
How it works
It tracks external swing highs and lows, validates the break with body-size and ATR filters, then anchors a zone to the candle the move started from. Full logic and inputs in the Manual.
What's included
- MetaTrader 5 indicator file (.ex5)
- Full manual with annotated chart examples
- All inputs open: swing length, OB strictness, zone mode, PA filters, EMA display
Best for
Intraday and swing traders on indices, gold and major FX pairs, M5 to H4, trading structure and retests rather than fixed signals.
Get access
Browse the ZynAlgo marketplace
Trading involves risk - this is an analysis tool, not trading advice.
ICT SMC
What ICT SMC refuses to draw
ICT SMC [ZynAlgo] is a chart-mapping tool for MetaTrader 5, and most of its work is subtraction. It does not attempt the whole Smart Money curriculum. It does one narrow job: mark the structure events that genuinely broke a swing level, and turn only those into order block zones worth watching.
Where other smart-money tools compete on how much they can find - every gap, every wick, every zone - this one competes on how little it leaves behind. A zone is only allowed onto the chart if a qualified break of structure or change of character created it, and it is taken off again as soon as price has traded through half of it.
What it reads from your chart:
- External swing highs and lows, located with a configurable pivot length
- Break of Structure (BOS) and Change of Character (CHoCH) events that survive a body-size and range filter
- Liquidity sweep and manipulation sequences at the last external high or low
- Order block zones anchored to the candle the break started from
- Price action candles - pin bar, engulfing, inside-bar break, rejection wick - that occur near those zones
- Optional EMA 21 / 50 / 200 lines, plus an optional higher-timeframe EMA reference
What you end up with is a chart you can still read: a few live zones, structure events named where they happened, and markers that only show up where the tool already has a reason to look.
Understanding the Break-Validated Order Block
An order block here means one specific thing: the last opposite-direction candle before price broke a swing level with force. It matters because that candle is where the move started, and it is the area price tends to revisit before it either continues or rejects.
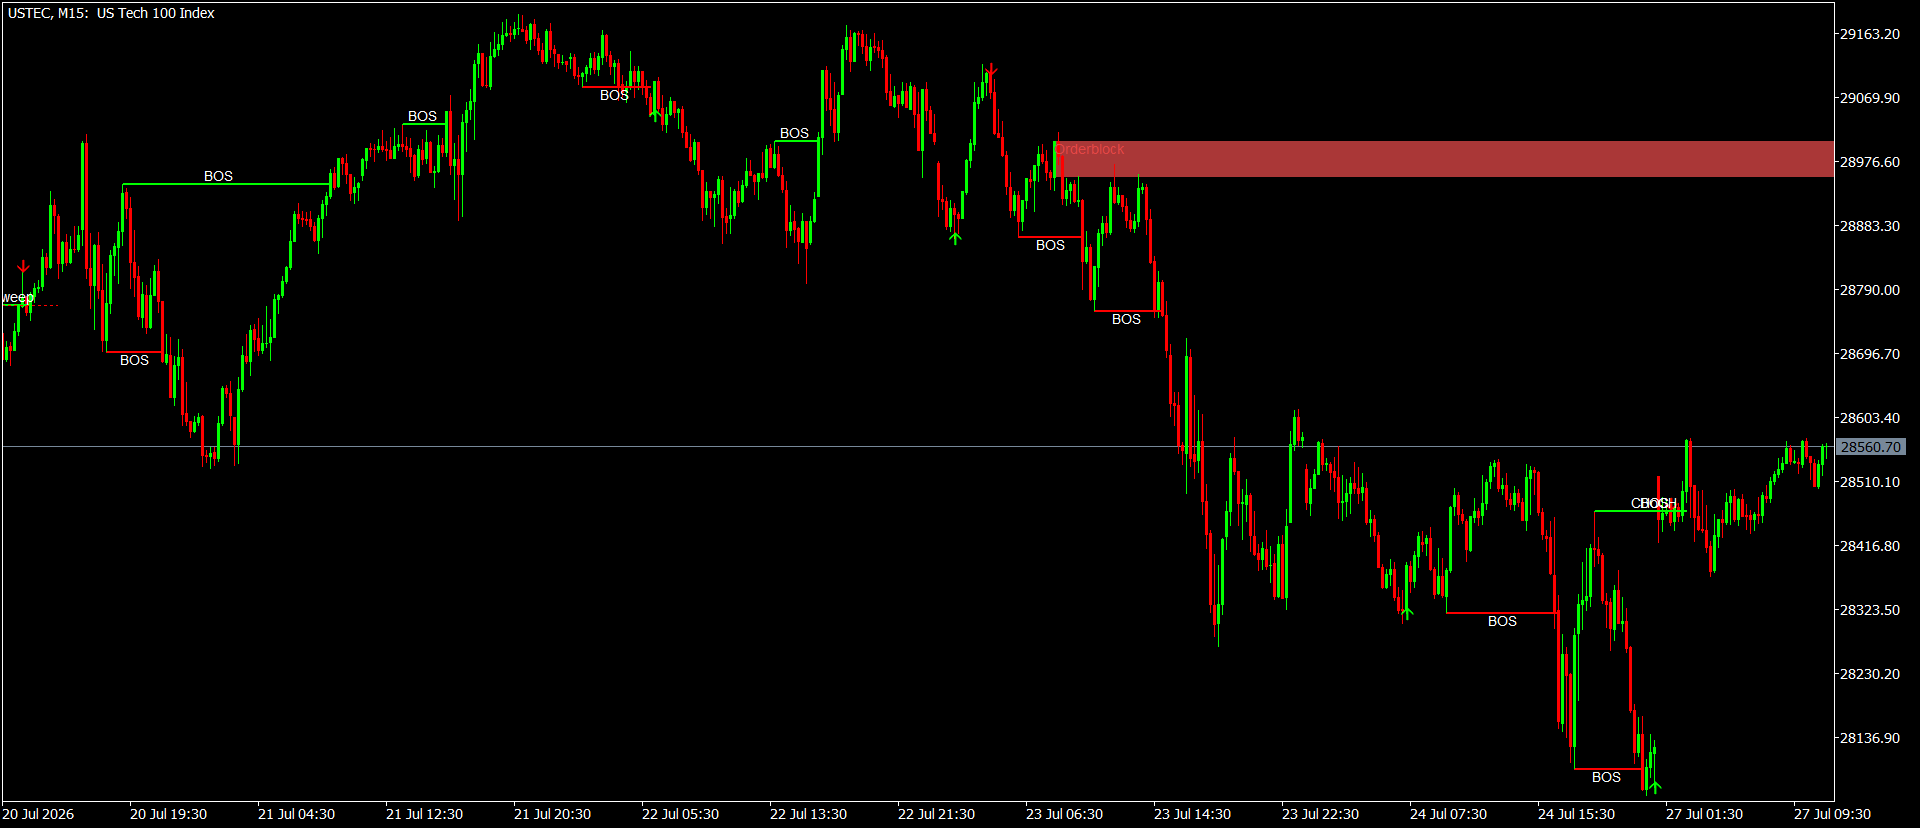
- Zones are drawn as coloured boxes labelled "Orderblock" and extended to the right
- Bullish (demand) zones are green, bearish (supply) zones are red
- Only the most recent zones stay on screen - the cap is Max Zones Per Side, three by default
- Overlapping or near-identical zones are rejected, so duplicates do not stack up
- A zone thinner than 0.20 ATR is widened to that minimum so it stays visible
Two mistakes are common here, and they pull in opposite directions. The first is treating every strong candle as an order block, until the chart carries more levels than it has meaning. The second is keeping a zone alive long after price has already worked deep inside it. Requiring a structural break before a zone is born handles the first; deleting a zone once it is used handles the second.
How a Break-Validated Order Block is defined
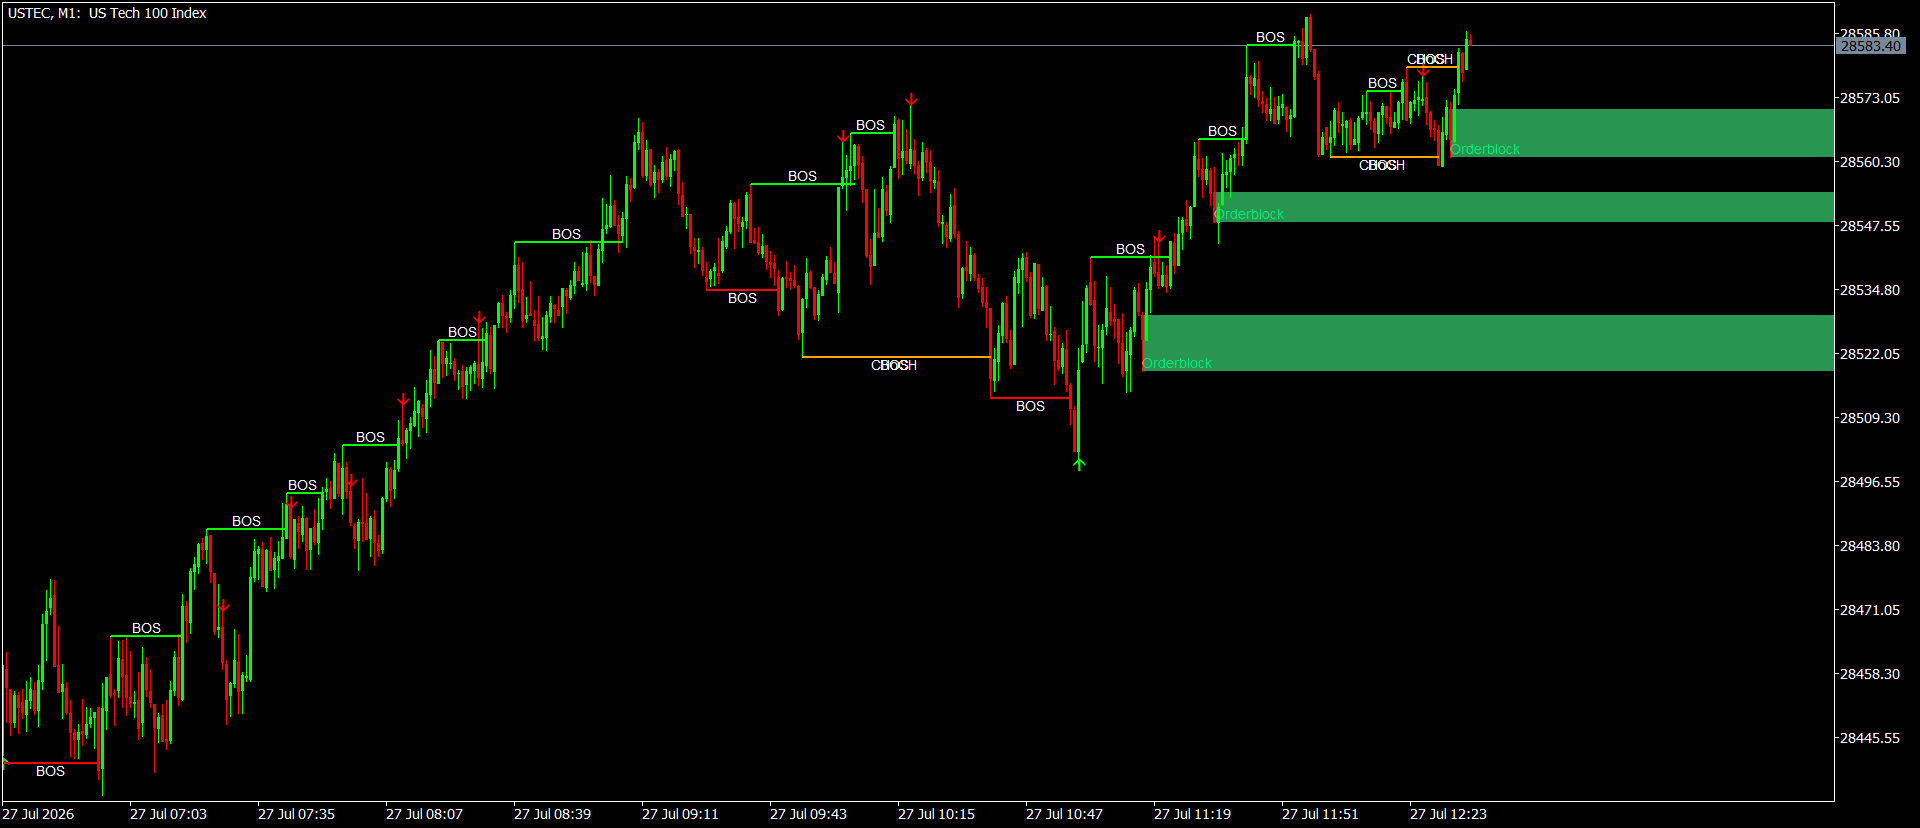
A zone is only created when all of the following line up on a confirmed bar:
- Structure event - a BOS or CHoCH has to fire first; with no break there is no zone
- Break quality - the breaking candle needs a body of at least 45% of its range, and a range of at least 0.60 ATR
- Origin candle - the tool looks back up to 8 bars for the most recent candle running against the break
- Displacement or FVG - depending on OB Strictness, the origin candle must be followed by a fair value gap (Strict), by a gap or a strong wide-range candle (Balanced), or by nothing at all (Loose)
- Zone geometry - OB Zone Mode decides whether the box uses body plus wick, or the full high-to-low range
- ATR - the volatility yardstick behind break size, minimum zone height and duplicate spacing
When to act (and when not to)
ICT SMC [ZynAlgo] issues no buy or sell orders. There are no entry signals, no alerts and no trade dashboard. Everything on the chart is context, so the workflow below is about reading it rather than obeying it.
Reading the structure labels
- BOS - price closed beyond the last external swing with a strong body. Structure carried on in the same direction
- CHoCH - price closed back through the protected swing after a liquidity sweep, printed in orange. This flags a possible shift, not a confirmed reversal
- BSL Sweep / SSL Sweep - a three-candle manipulation sequence: a strong candle pushes past the last external high or low, the next candle stalls, and the third closes back hard the other way
Working with the zones
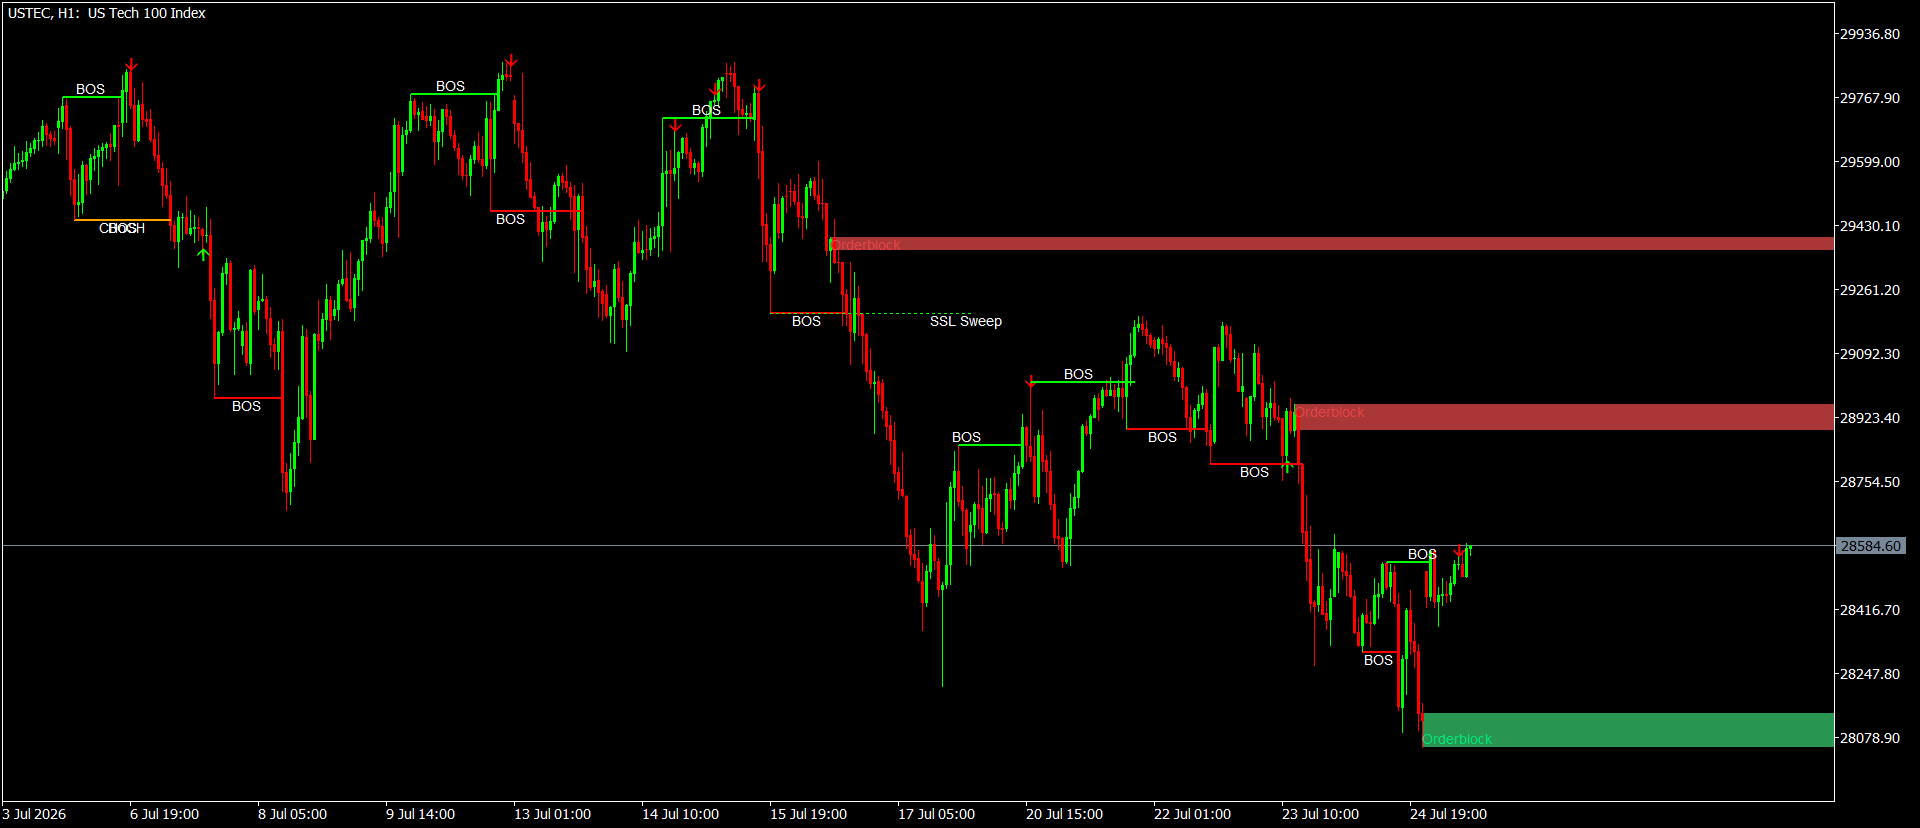
- Wait for price to come back to a live zone instead of chasing the break itself
- Green triangles below a bar and red triangles above a bar are price action markers. In the default Premium Only mode they print only when the candle is a pin bar, engulfing candle, inside-bar break or rejection wick AND price is near a zone, an external swing or a failed break
- A marker says a reaction happened where the tool expected one. Confirmation, sizing, stops and targets stay your decision
- When a zone disappears, price has reached its 50% mid-line or closed decisively beyond it. The zone has been used and is no longer treated as fresh
- Cooling-off logic keeps markers at least 8 bars apart, so one busy area cannot spam arrows
If you want more markers for study rather than for trading, switch PA Visual Mode to All PA - that drops the near-a-zone requirement and prints considerably more.
Best suited for
ICT SMC [ZynAlgo] suits traders who already work with structure and want the bookkeeping handled for them:
- Discretionary traders who trade order block retests and want the zones filtered by a real structural break
- Intraday traders on liquid markets - indices, gold and major FX pairs - where swing levels get respected
- Traders working anywhere from 5-minute to 4-hour charts; External Swing Length tunes the sensitivity per timeframe
- Anyone who would rather read three zones per side than a screen full of boxes
It is not built for traders who want something to follow. There is no arrow that says buy, no alert to wait for and no automation. The value is in seeing fewer, better-qualified levels and making the call yourself.
Installing it: copy the .ex5 file into the MQL5/Indicators folder inside your terminal's data folder, refresh the Navigator panel in MetaTrader 5, then drag ICT SMC onto the chart. Swing length, OB strictness, zone mode, PA filters and EMA display are all editable in the Inputs tab.
Browse the ZynAlgo marketplace
Trading involves risk. Nothing this indicator draws is a recommendation, and past chart behaviour does not predict future results.
- v1Jul 21, 2026
Initial release
How to filter order block zones when your chart is cluttered with levels
Most smart-money tools mark every gap and wick until the chart is unreadable. ICT SMC MT5 draws only order blocks validated by a qualified break of structure, then removes them once price has used them.
How to Filter Order Blocks by Real Break of Structure on MT4
Most order block indicators draw every supply and demand zone they can find, leaving your chart cluttered and forcing you to guess which levels actually matter. Learn how a break-validated filter keeps only zones created by genuine structural events.
Why My Order Block Zones Clutter My Chart and Stop Working
You mark every strong candle as an order block, price never returns to most of them, and your chart becomes unreadable. By the end you will know how a break-validated zone system keeps only the order blocks that matter.
Why do my order block zones never actually hold when price returns
Traders mark every strong candle as an order block, then watch most levels fail when retested. A structure-validated approach filters zones by confirmed breaks and removes them once used.