CHOP Trend Reentry Signal
A trend entry taken inside chop is not a trend entry. This indicator reads the range-versus-trend state first, and only then lets an ordinary pullback trigger become a signal.
Key benefits
- Regime before entry - the Choppiness Index has to leave its ranging zone before any trigger counts, and the permission it grants expires on a countdown
- Pullback, not breakout - entries come from RSI reclaiming its midline or a Stochastic cross out of an extreme, so you join the trend on a pause rather than an extension
- Direction proven three ways - ADX strength, DI dominance and an EMA pair with a positive slope all have to agree before the window can be used
How it works
The Choppiness Index leaving its trend threshold opens a window for a set number of bars. While that window is open, ADX, DI and the EMA pair decide the direction, and an RSI or Stochastic reentry fires the signal. Full rule set is in the Manual.
What's included
MetaTrader 5 indicator file (.ex5), with regime, trend, pullback, filter and risk settings open in the Inputs tab.
Best for
Intraday trend traders on FX majors, gold and indices, M5 to M30, who want several entries out of one trend leg instead of one perfect breakout.
Get started
-> Browse the ZynAlgo marketplace
Trading involves risk. This indicator is an analysis tool for educational purposes and does not guarantee results.
CHOP Trend Reentry Signal
Why the regime is checked before the entry
CHOP Trend Reentry Signal is a trend-continuation indicator for MetaTrader 5. It separates two questions most tools answer at once: is this market trending at all, and is now a good moment to join. The Choppiness Index answers the first, and only if that answer is yes does anything else get a vote.
Every closed candle is measured against:
- Regime - the Choppiness Index over 14 bars, read against a trending threshold of 38.2 and a ranging threshold of 61.8
- Strength - ADX(14) against a floor of 22, with +DI and -DI deciding which side is in control
- Structure - an EMA pair, 8 over 21, with the slow line required to be sloping the same way it is stacked
- Pullback - RSI(14) reclaiming its 50 level after a dip into the pullback zone, or a Stochastic %K/%D cross out of an extreme
- Context filters - optional higher-timeframe EMA direction, session, spread cap, a maximum candle range, and a cooldown between signals
What lands on your MetaTrader 5 chart is an EMA ribbon coloured by the live regime, a band marking the bars where the trend window is open, signal arrows, a measured trade box, and a separate logic window carrying CHOP, ADX, both DI lines, RSI, both Stochastic lines, ATR and spread as their own lines.
The trend window, and what opens it
The regime does not gate each bar in isolation. Leaving chop opens a window, and that window is what later triggers spend.
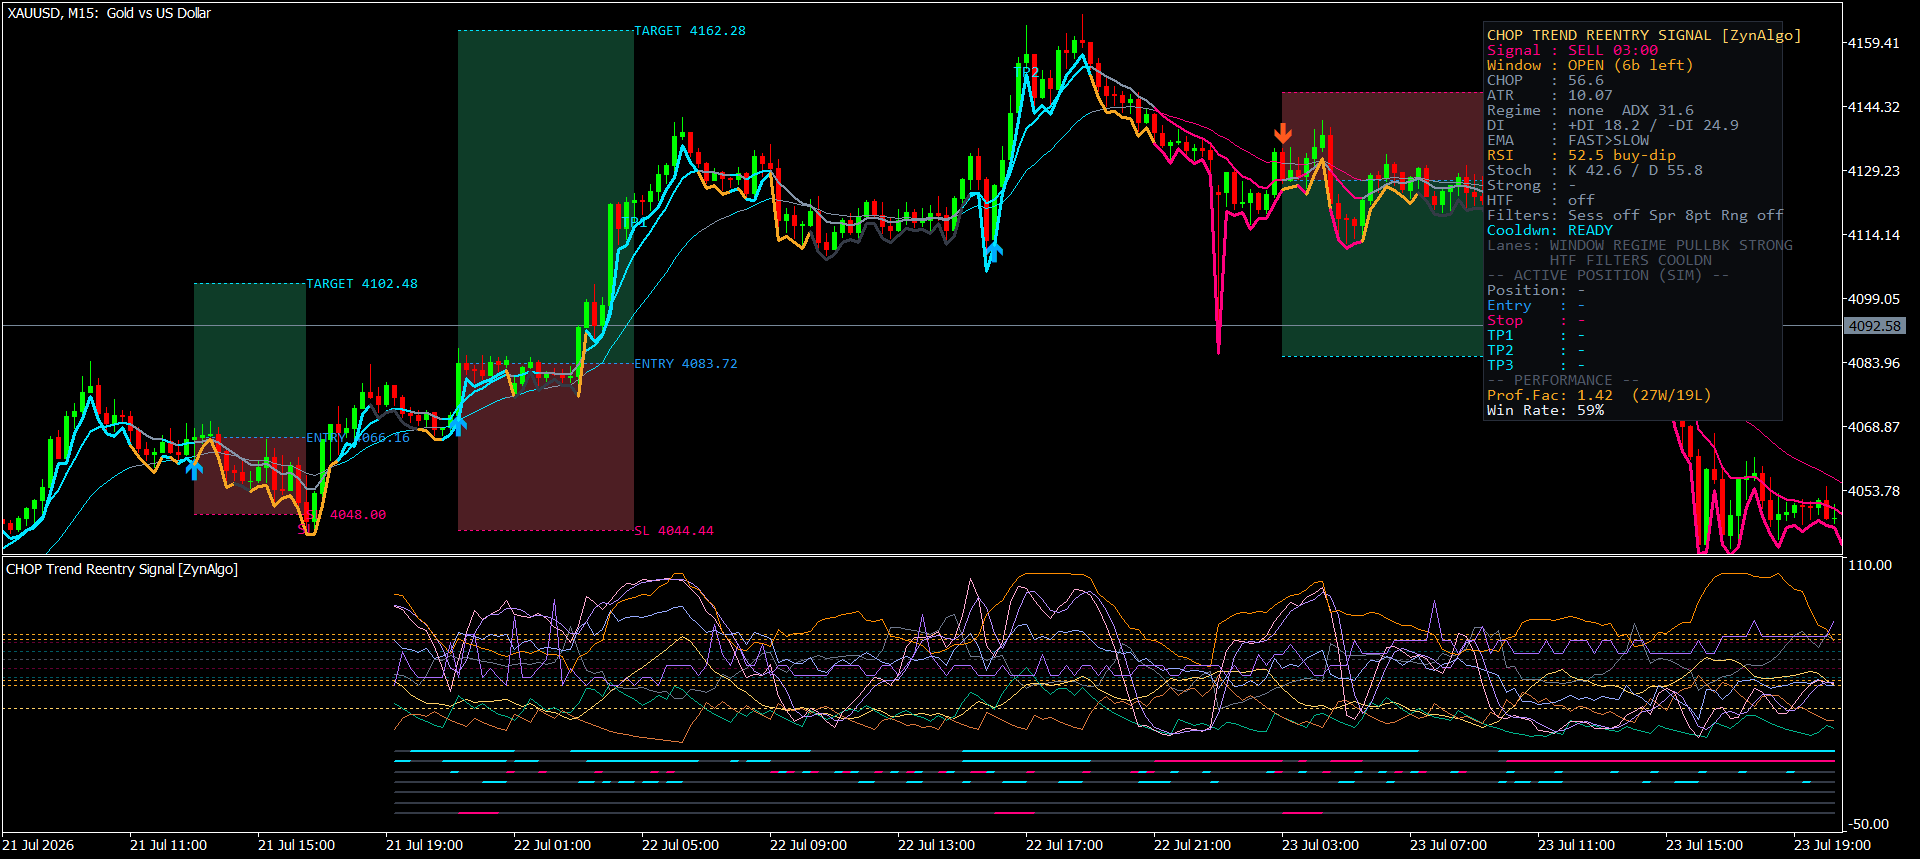
- The window opens when CHOP drops below the trending threshold of 38.2, or crosses down through the ranging threshold of 61.8
- It stays open for 12 bars by default, and every fresh qualifying bar restarts the count
- The panel reports it live as "Window : OPEN (6b left)", so you know how much permission is left before the trigger has to appear
This is what lets one trend leg produce several entries rather than one. A single reading of "the market is trending" is not treated as a single trade; it is treated as a period during which pullbacks are worth taking.
How direction and the pullback are defined
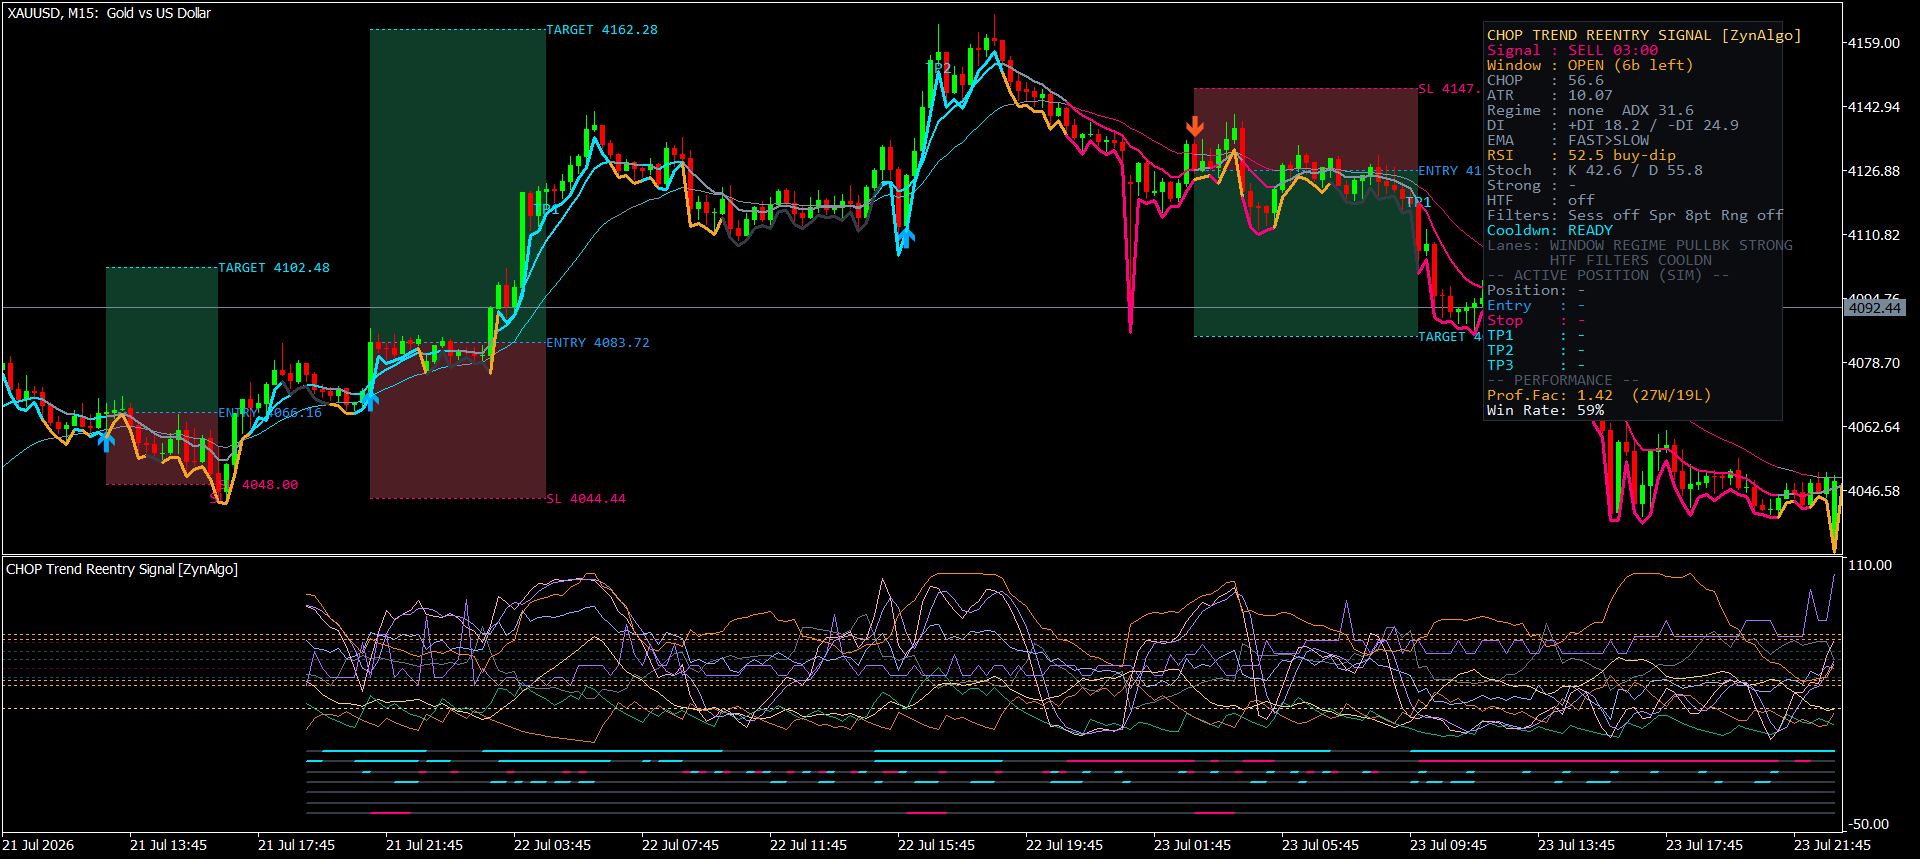
- Regime direction - ADX above 22, the dominant DI on the right side, EMA(8) stacked correctly against EMA(21), and EMA(21) sloping the same way over the last 3 bars. The panel prints "Regime", "DI" and "EMA" as separate rows so you can see which one is failing
- RSI trigger - RSI must have visited the pullback zone within the last 10 bars, 40 to 55 for a buy or 45 to 60 for a sell, and then cross back through 50. The panel marks it as "RSI : 52.5 buy-dip"
- Stochastic trigger - as an alternative, %K crossing %D after either line has been below 35 for a buy, or above 65 for a sell
- Strong tier - CHOP still falling and ADX rising for 2 consecutive bars upgrades the signal and draws a larger arrow
- Cooldown - after a signal, the same direction is muted for 5 bars
Reading a signal on the chart
Signals are evaluated on closed candles only, never on the candle still forming.
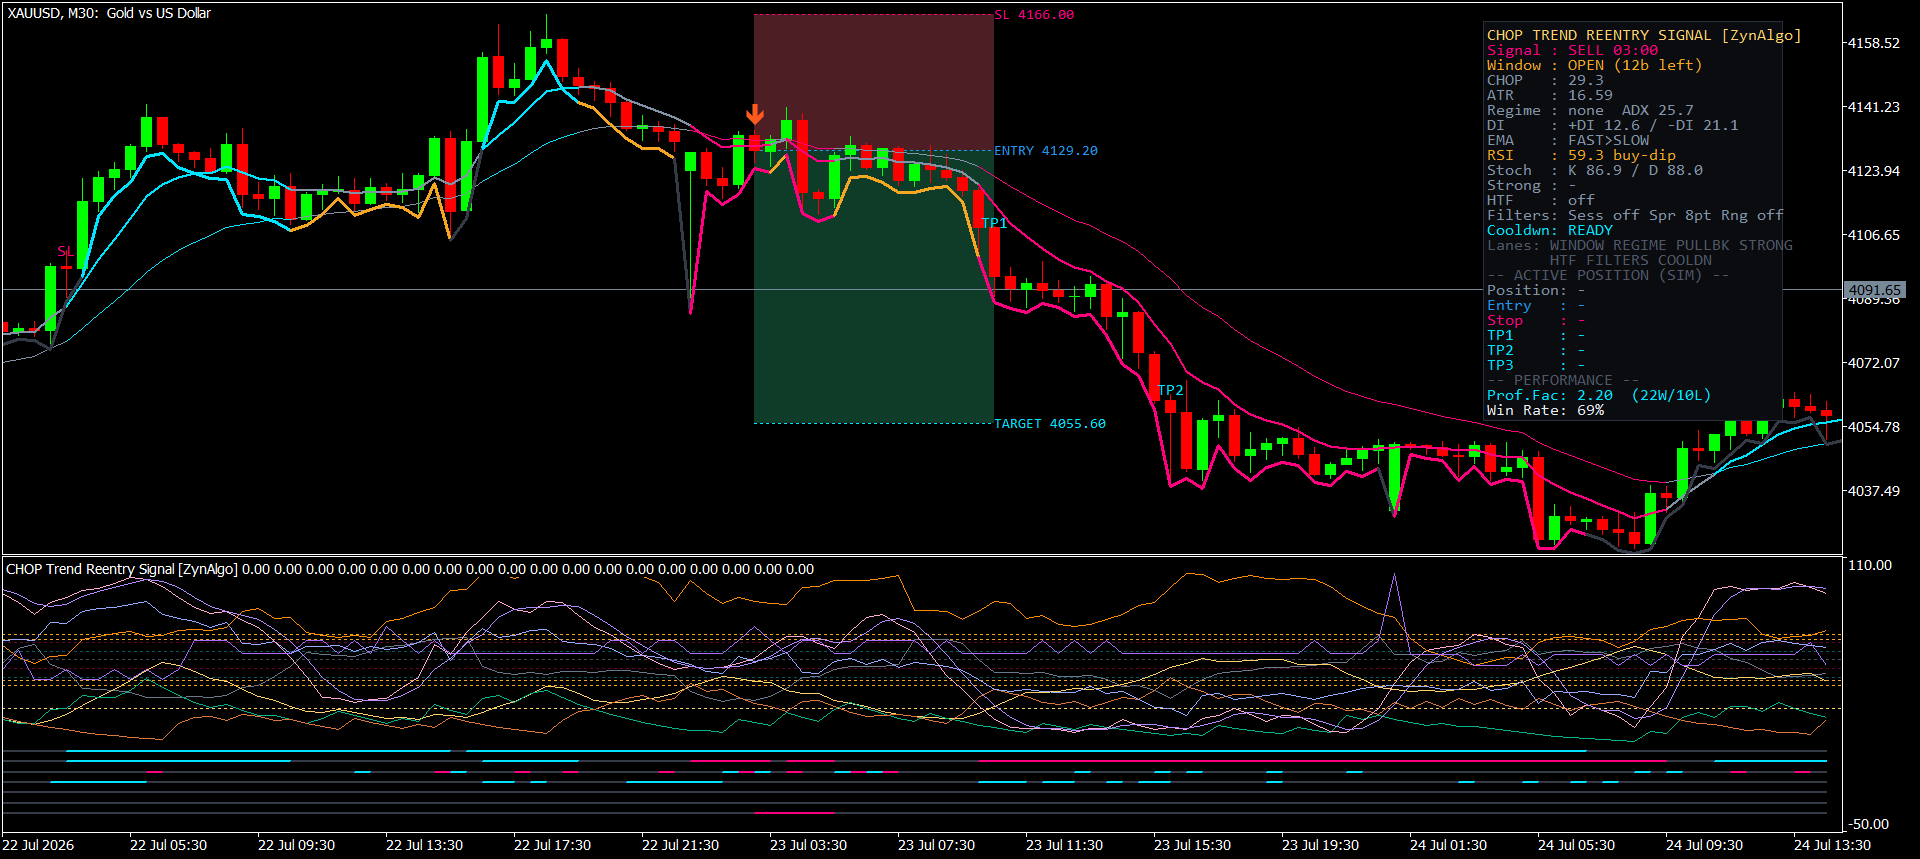
A BUY prints when the trend window is open, the bullish regime holds on all three of ADX, DI and the EMA pair, and either the RSI or the Stochastic pullback trigger fires - with the cooldown clear and the optional filters allowing the bar. A SELL is the mirror image.
What appears on the chart:
- An arrow below the candle for BUY and above it for SELL, offset by 0.30 ATR, drawn larger when the strong tier also applies
- An EMA ribbon and a regime band that stay on the chart between signals, so the current state is visible even when nothing has fired
- A trade box with ENTRY, SL and TARGET labels: entry at the signal candle close, stop at the 20-bar swing behind the entry or 1.2 times ATR, whichever is wider, then targets at 1R and 2R by default, with 3R available
- A status panel carrying the live CHOP and ATR values, the regime rows, the pullback state, the strong-tier flag, filter status, the simulated position, and the running Profit Factor and Win Rate of the signals on that chart
Note that the indicator marks the chart rather than sending pop-up alerts. That is deliberate: the window and the regime rows are meant to be read before an arrow appears, not chased after one does.
Who gets the most out of this indicator
It suits you if:
- You trade with the trend and want to add on pullbacks rather than catch the initial break
- You have been burned taking clean-looking entries that turned out to be inside a range
- You want a stop tied to recent structure with a volatility floor underneath it
- You are comfortable reading a separate logic pane where CHOP, ADX, DI, RSI, Stochastic, ATR and spread each have their own line
Working ranges from the product spec: FX majors M5-M30 - XAUUSD M5-M15 - index CFDs M5-M15. Symbol names for indices differ between brokers, so match the instrument rather than the exact ticker.
It suits you less if you want reversal calls. Everything here is built to trade with the dominant side, and in a genuine range the window simply never opens - which is the point, but it does mean quiet stretches.
Installing it: copy the .ex5 file into the MQL5/Indicators folder inside your terminal data folder, refresh the Navigator panel in MetaTrader 5, then drag CHOP Trend Reentry Signal onto a chart. If you were issued an Access Key, paste it into the Access Key input. Every threshold above is editable in the Inputs tab.
-> Browse the ZynAlgo marketplace
This indicator is provided for educational purposes only and is not financial advice. Trading involves risk; past performance and backtested behaviour do not guarantee future results.
- v1Jul 22, 2026
Initial release

Why Your Trend Entries Keep Stopping Out in Ranging Markets
You see momentum, stack your indicators, and still get whipsawed when the market was never trending at all. Learn how regime-first filtering separates genuine continuation setups from noise.
Why My Trend Entries Get Stopped Out in Ranging Markets
You spot a trend, wait for a pullback, and enter, only to watch it chop sideways and stop you out. Here's how checking the regime first changes what signals you allow.