Synthetic Volatility Snapback
Volatility-index style tools are popular but usually directionless. Synthetic Volatility Snapback builds a chart-local volatility oscillator on MetaTrader 5 from ATR, standard deviation and Bollinger bandwidth, then fires snapback signals when an extreme push closes back into a mean-reversion lane.
Key benefits
- A volatility oscillator with direction - a synthetic score with 70/85/90 percentile lines, plus an actual BUY or SELL, not just a reading
- Snapback, confirmed - a signal needs a volatility extreme, a band breach and an RSI(7) turn back inside, so you fade exhaustion, not a trend
- Two tiers - a regular snapback plus a strong tier when the score turns down from above the 90th percentile with enough range left to move
- Risk already measured - stop beyond the exhaustion candle plus 0.2 ATR, targets at the adaptive mean and the opposite half-band
How it works
The synthetic volatility score rises above its 85th percentile, price closes beyond an adaptive band, then within 6 bars closes back inside while RSI(7) turns and the candle closes past the prior candle's extreme - a snapback BUY or SELL on the closed candle. The strong tier adds a turn down from above the 90th percentile. Full rule set is in the Manual.
What's included
MetaTrader 5 indicator file (.ex5), with volatility, percentile, ATR, band and RSI settings open in the Inputs tab.
Best for
Intraday mean-reversion traders on gold M5-M15, indices M1-M15 and crypto M15-H1 who fade volatility exhaustion without wanting an external volatility feed.
Get access
-> Browse the ZynAlgo marketplace
Trading involves risk. This indicator is an analysis tool for educational purposes and does not guarantee results.
Synthetic Volatility Snapback
What has to line up before a signal can print
Synthetic Volatility Snapback is a mean-reversion signal indicator for MetaTrader 5. It builds its own volatility measure from the chart's price action - no external VIX or benchmark - and only fires when an extreme volatility push exhausts and snaps back into a controlled lane.
Every closed candle is measured against:
- Synthetic volatility score - a chart-local reading from ATR, standard deviation and Bollinger bandwidth, ranked by percentile
- Extreme - the score pushing above its 85th percentile, with the strong tier above the 90th
- Band breach and reclaim - price closing beyond an adaptive band, then back inside within 6 bars
- Momentum turn - RSI(7) crossing back through 35 for longs or 65 for shorts
- Context filters - band width, EMA50 slope risk, spread and a warm-up minimum
Only when the volatility extreme, the reclaim and the RSI turn agree does a BUY or SELL arrive.
Reading the synthetic volatility oscillator
Volatility tools usually tell you how wild the market is but not what to do about it. This one ranks its own score by percentile and uses the extremes as fade triggers, because a snapback is only worth taking after a genuine spike.
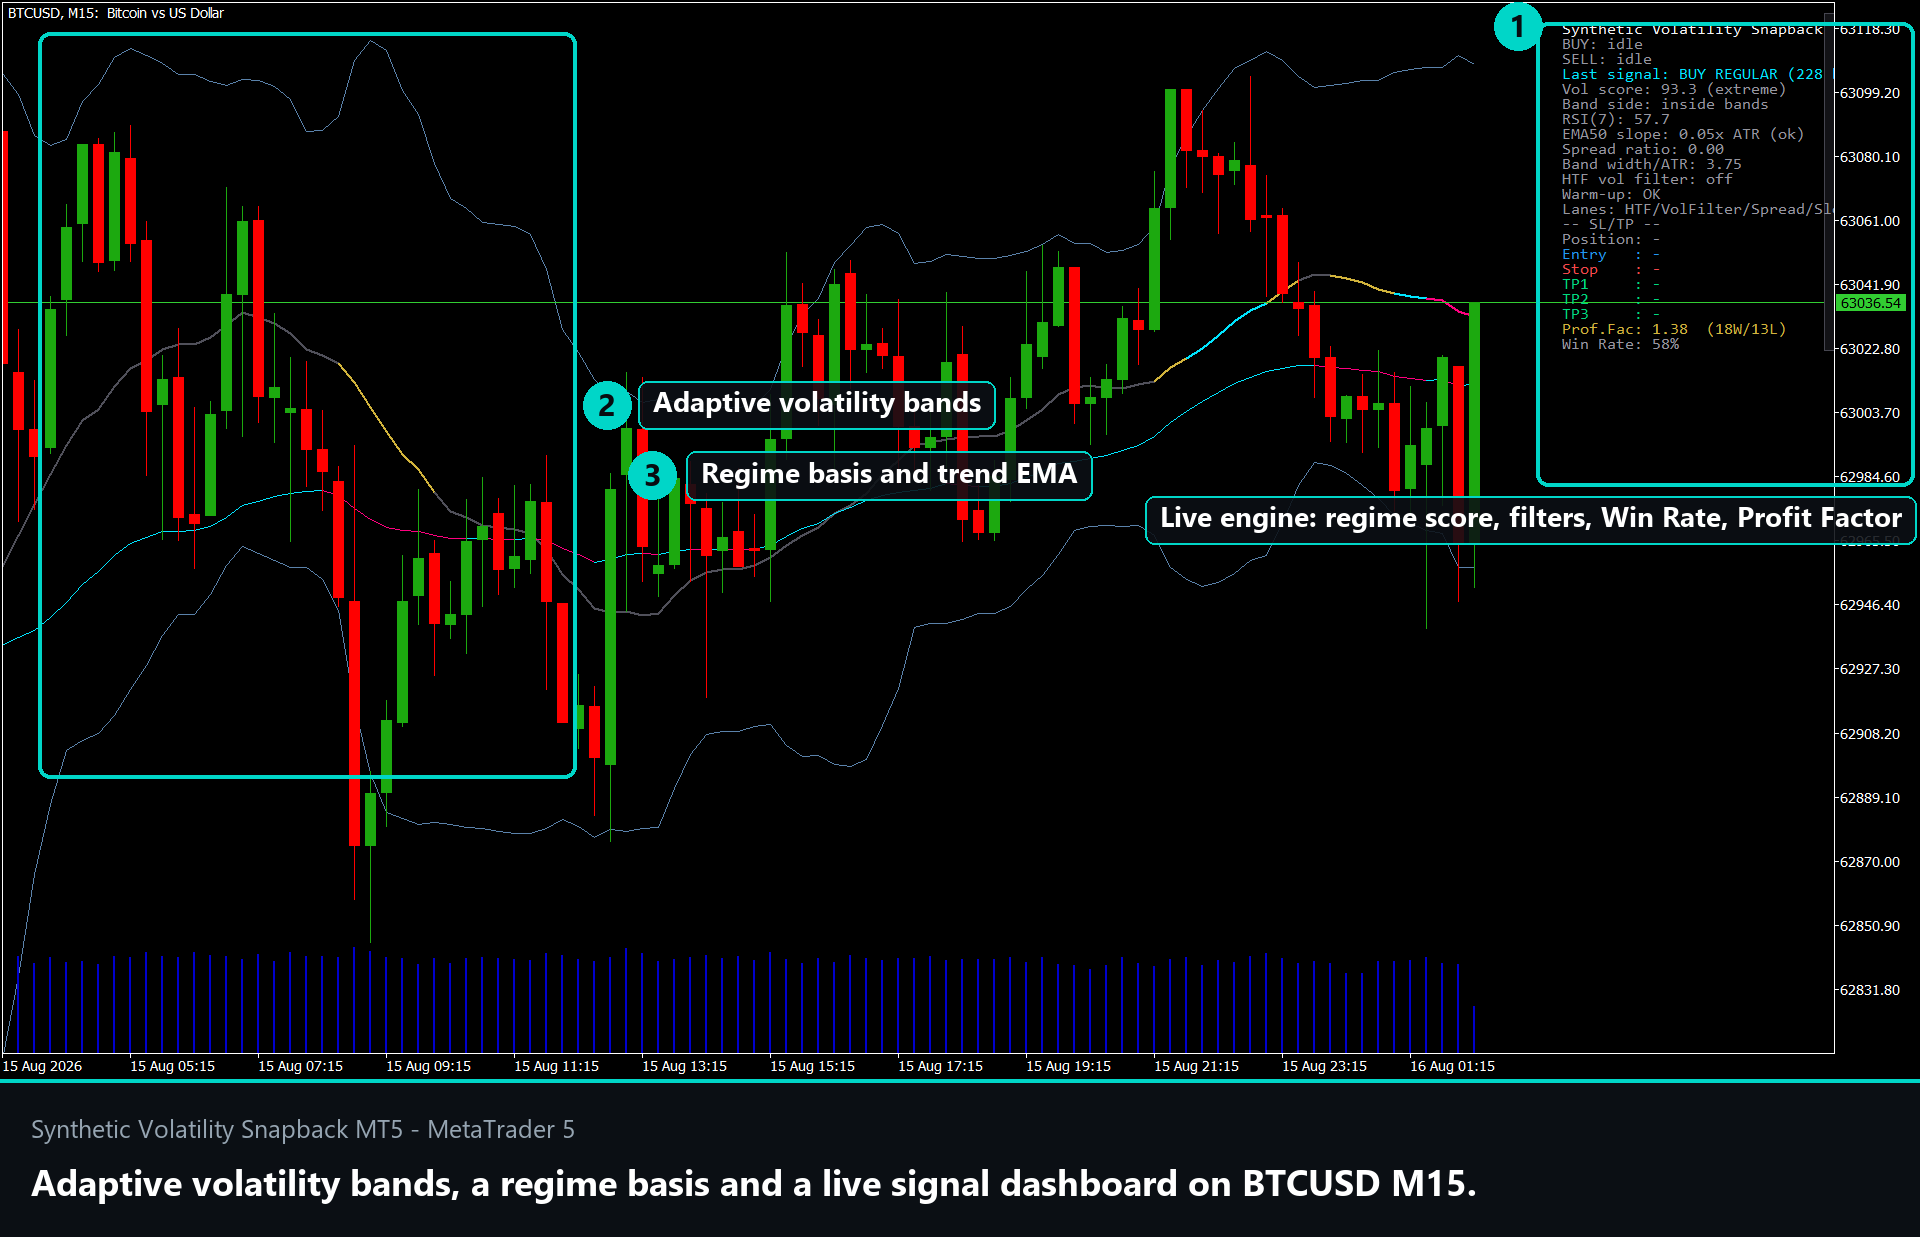
- The dashboard volatility-regime score reports the synthetic score against its 70/85/90 percentile thresholds
- The adaptive bands and centerline on the main chart show the mean-reversion lane the snapback targets
- The mistake this avoids is fading every band touch - the score has to be at a genuine percentile extreme first
How the snapback is defined
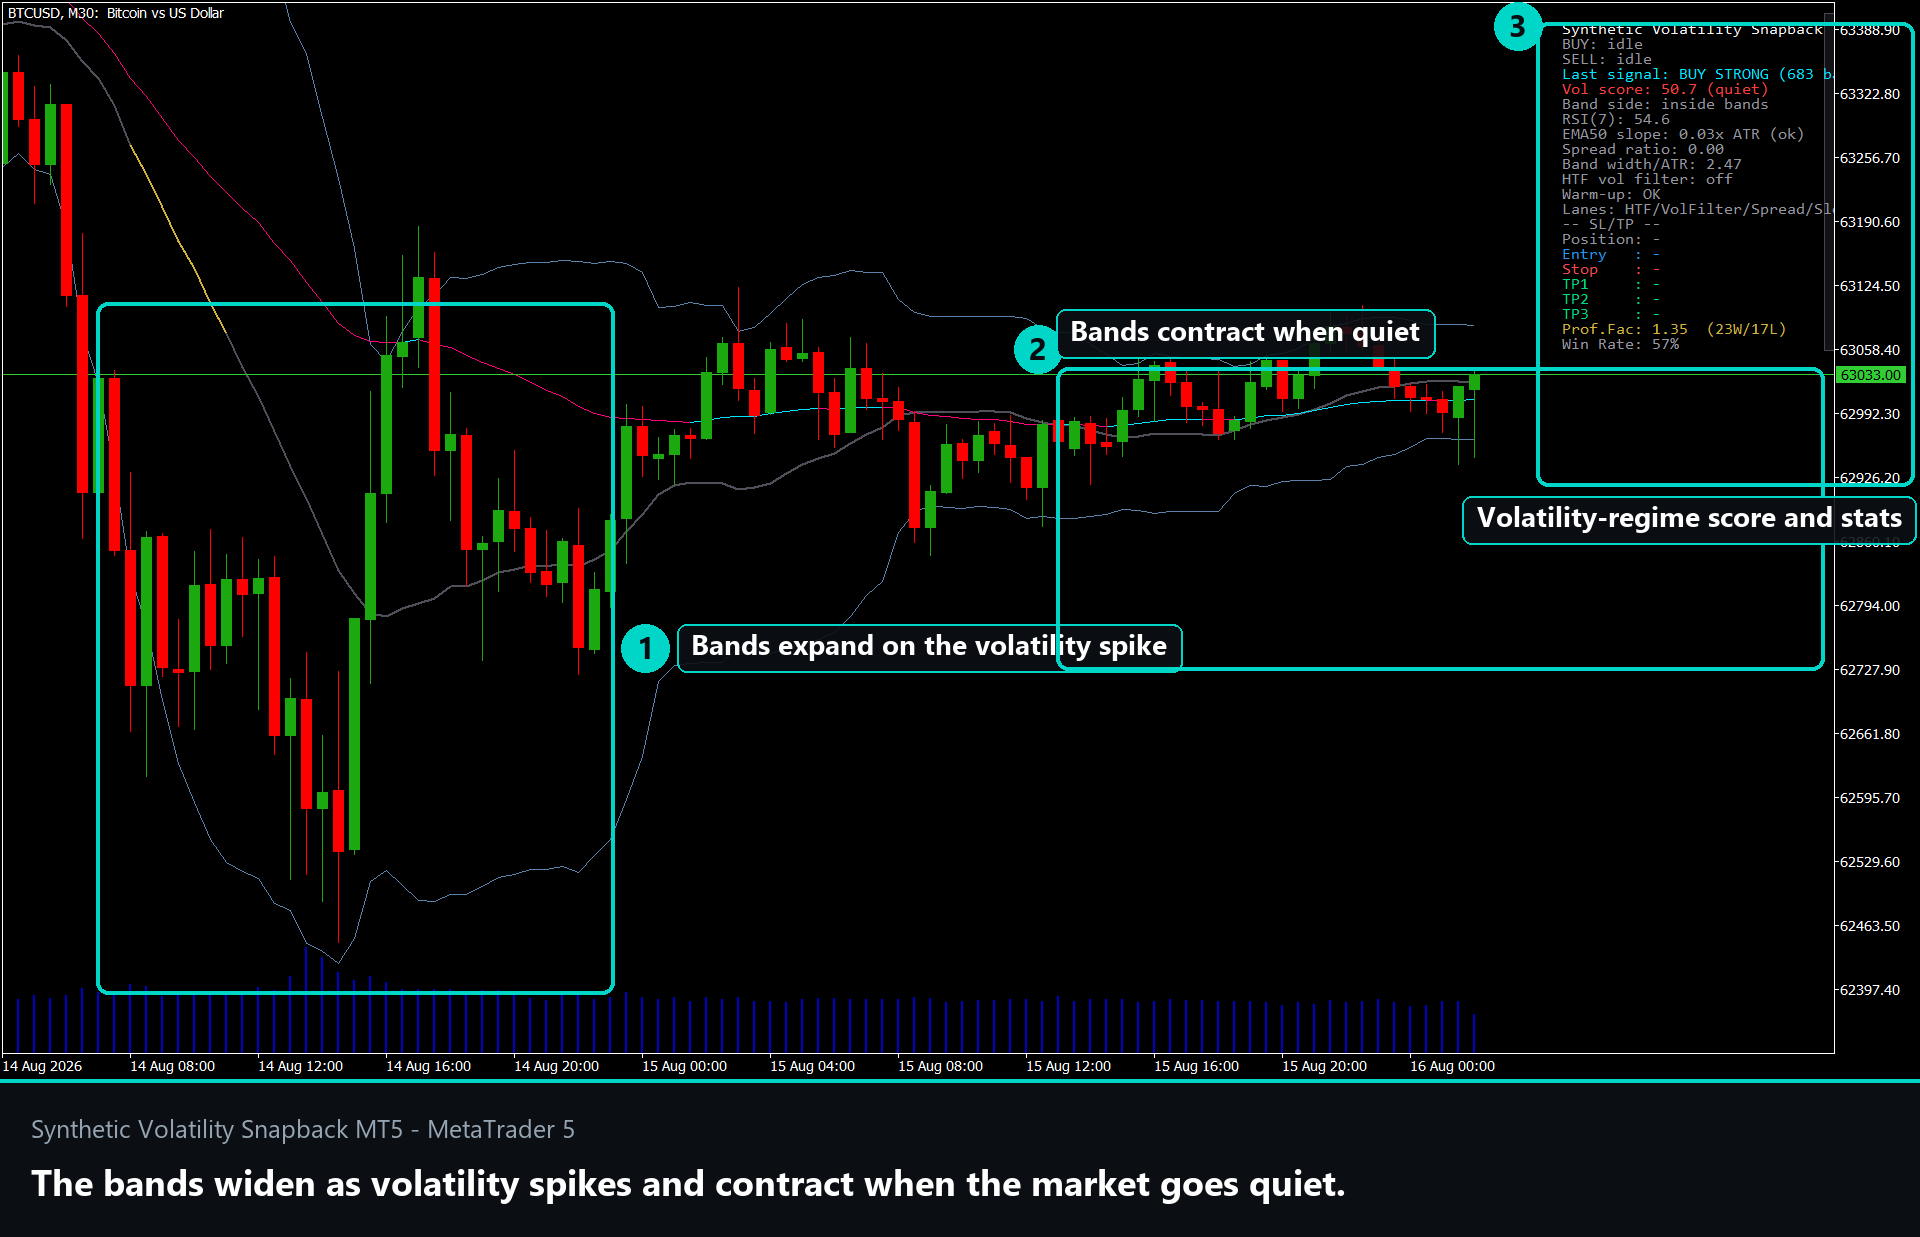
- Spike - the synthetic volatility score rises above its 85th percentile (90th for the strong tier)
- Breach - price closes below the lower adaptive band for a long, or above the upper band for a short
- Reclaim window - within 6 bars price closes back inside the band, with RSI(7) crossing up through 35 or down through 65
- Range check - the strong tier requires the trigger candle range to stay at least 0.8 ATR so there is room left to reach the mean
From spike to signal: reading an arrow
Signals are confirmed on closed candles; live intrabar state is only previewed.
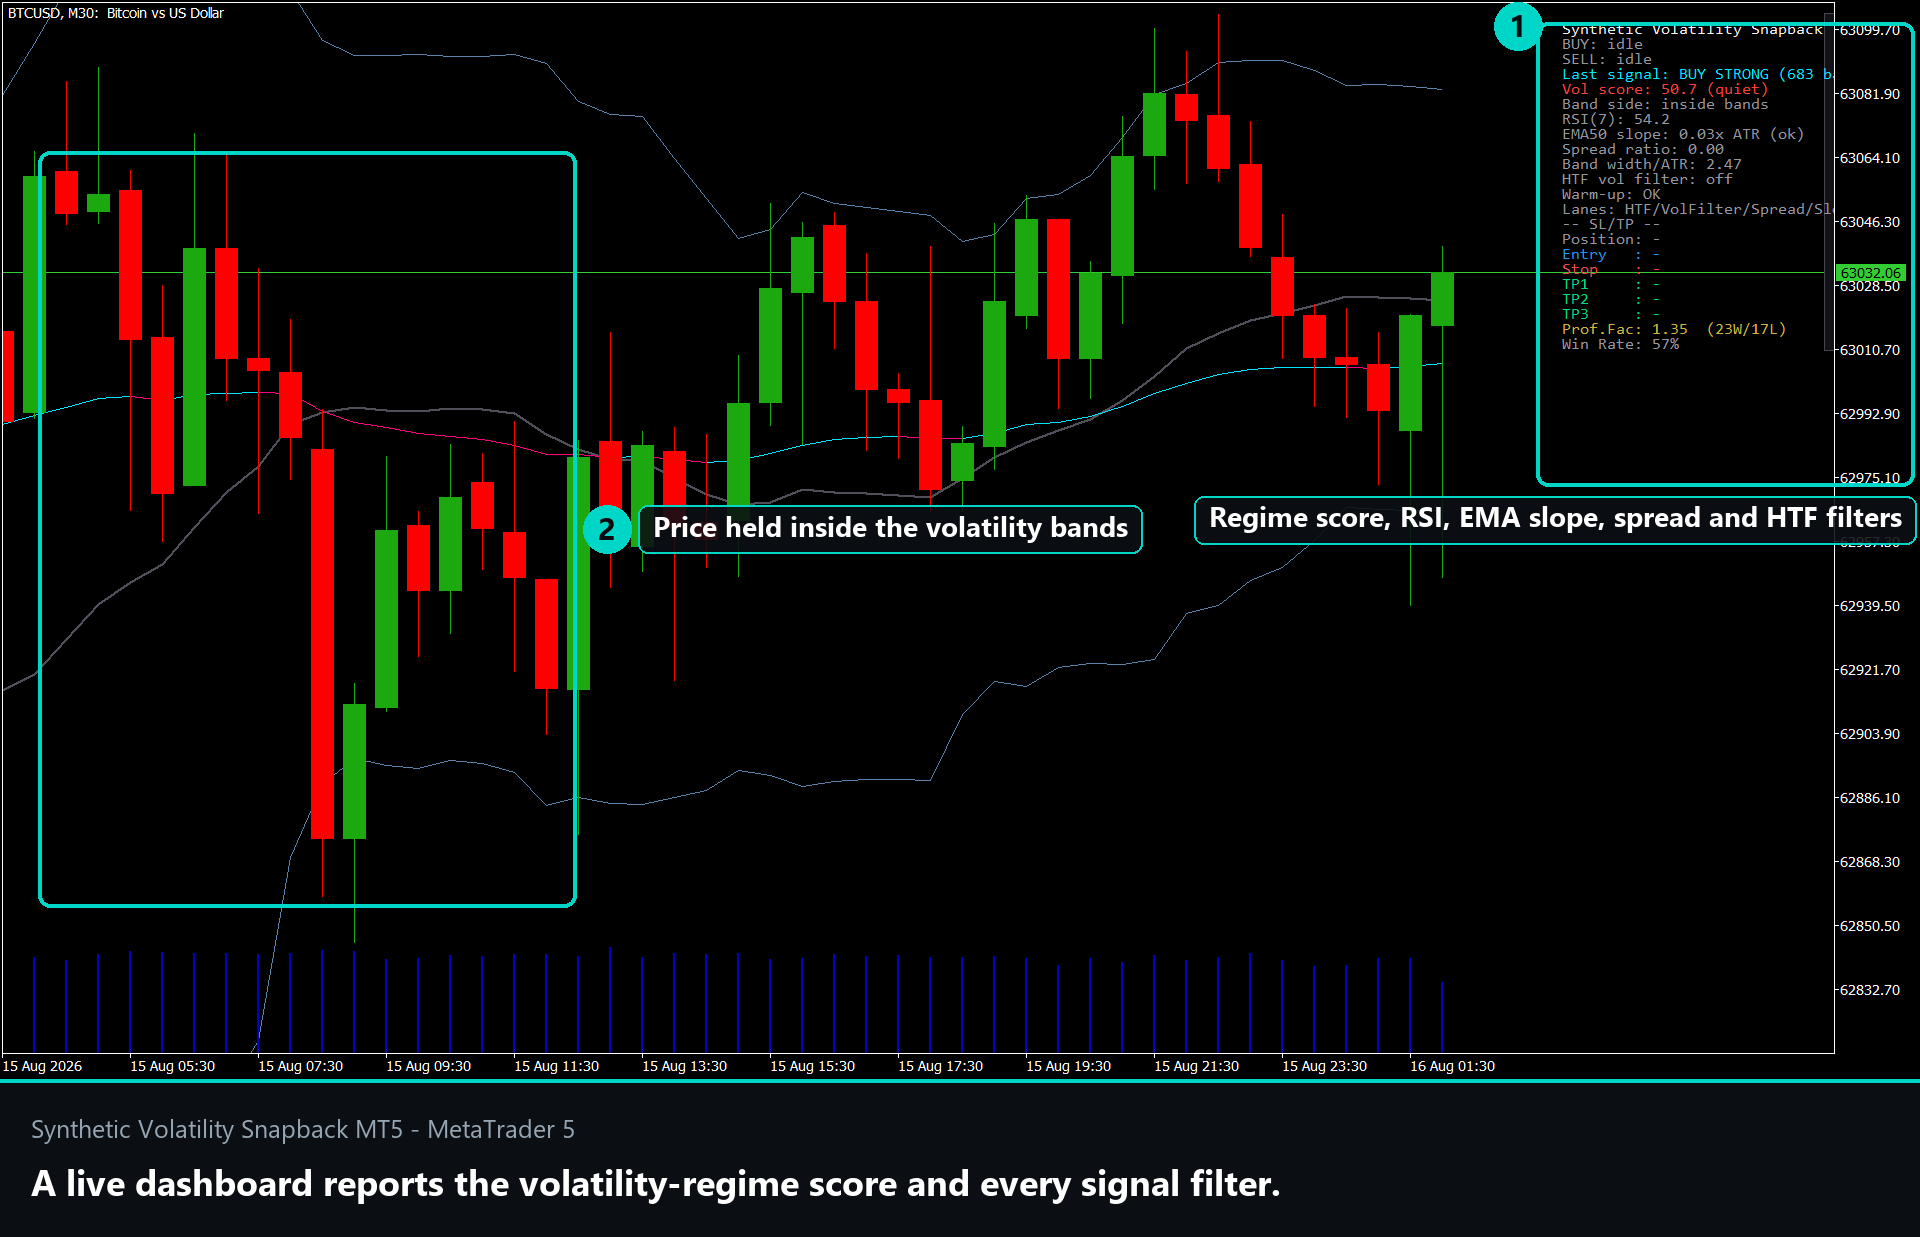
A BUY prints when:
- The synthetic volatility score is above its 85th percentile
- Price closed below the lower adaptive band, then back above it within 6 bars
- RSI(7) crosses above 35 and the candle closes above the previous candle high
- Band width, EMA50 risk, spread and warm-up filters allow the bar; the strong tier adds a turn down from above the 90th percentile with a 0.8-ATR range
A SELL is the mirror image: a score above the 85th percentile, a close above the upper band then back inside, RSI(7) crossing below 65 and a close below the prior candle low, with the same filters.
What appears on the chart:
- The dashboard volatility-regime score, the adaptive bands and centerline, a volatility regime ribbon and exhaustion markers
- A BUY or SELL arrow with entry at the snapback close, a stop beyond the exhaustion candle extreme plus 0.2 ATR, TP1 at the adaptive mean and TP2 at the opposite half-band, with a volatility-cooldown trail after TP1
- Alerts for volatility spike armed, regular and strong snapbacks, cooldown exit, TP touches and opposite snapback
Is Synthetic Volatility Snapback right for you?
It fits you if:
- You fade exhaustion and mean-revert after volatility spikes
- You want a volatility measure built from the chart itself, not an external index
- You would rather have the stop and targets attached to the signal
- You work on gold M5-M15, indices M1-M15 or crypto M15-H1
It fits you less well on one-way news moves and trend days, where mean-reversion snapbacks fail. Percentile thresholds need enough history to stabilise, and the synthetic score is price-derived, not a real options VIX. It makes no claim of guaranteed exhaustion.
Installing it: copy the .ex5 file into the MQL5/Indicators folder inside your terminal's data folder, refresh the Navigator panel in MetaTrader 5, then drag Synthetic Volatility Snapback onto the chart. Every threshold above is editable in the Inputs tab.
-> Browse the ZynAlgo marketplace
This indicator is provided for educational purposes only and does not constitute financial advice. Trading involves risk; past performance does not guarantee future results.
- v1Jul 22, 2026
Initial release

Why mean reversion signals fail after small volatility spikes
Most band or Bollinger touches trigger a fade, but only the ones after a genuine volatility extreme snap back reliably. Here's how a chart-local volatility measure changes which setups you take.

How to trade volatility snapbacks when price reclaims the mean
Most mean-reversion tools tell you when price touches a band, but not whether the volatility spike justifies the fade. This article shows how a synthetic volatility measure built from the chart itself can isolate genuine extremes and time the reclaim.