When to enter a pullback after the trend direction already changed
The pullback-or-chase dilemma
You see price close beyond the last swing, the trend direction changes on your chart, and now you face a choice: enter the breakout bar at the new high or low, or wait for a pullback that might never come. Chasing the breakout often places your entry far from structure, leaving the stop so wide it breaks position-sizing rules. Waiting blindly can mean you watch the entire move unfold without a clean entry.
Adaptive ATR Trend solves this by using a two-stage ATR engine to mark confirmed directional changes first, then watches for Heikin Ashi pullback transitions within the established trend. The result is a framework that tells you when the trend state has shifted and when a lower-risk re-entry appears.
How the two-stage ATR engine separates noise from direction
The first stage builds an adaptive baseline that follows price while adjusting to the current ATR. The second stage places wider trailing bands around that baseline and changes direction only when a closed bar moves beyond the active boundary. This cascading structure filters out ordinary candle noise and confirms that the trend state has genuinely flipped, bullish to bearish or bearish to bullish.
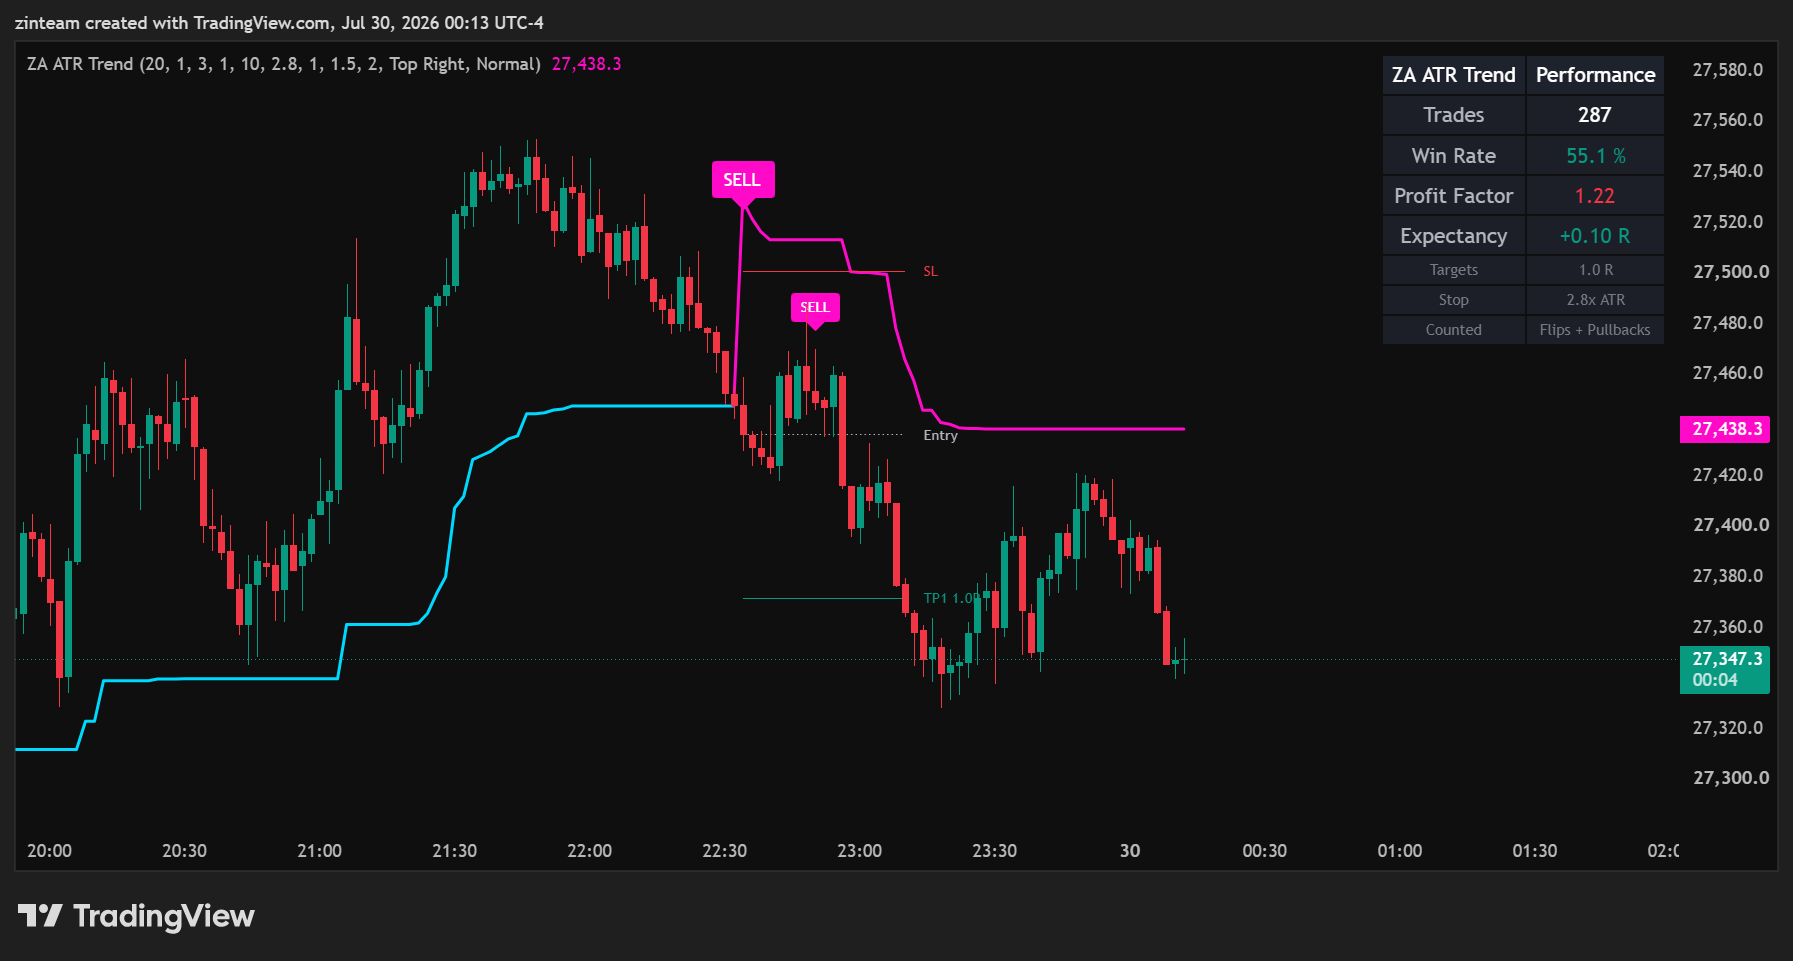
Once the engine declares a new trend, the chart color changes to reflect the active direction. A BUY trend flip marker appears after a bearish-to-bullish close; a SELL trend flip marker appears on the opposite transition. You now know the volatility-adjusted structure supports that direction.
From confirmed trend to pullback entry
After a trend flip, Adaptive ATR Trend continues to watch Heikin Ashi state during the established trend. If you are in a bullish trend and Heikin Ashi briefly turns bearish, then resumes bullish on the next closed bar, the tool can mark a BUY pullback, as long as the cooldown and maximum-signals-per-trend settings permit it. The same logic applies inversely during a bearish trend.
Each marker reason distinguishes Trend flipped bullish/bearish from Heikin Ashi pullback resumed the active trend. This separation gives you two distinct entry contexts: the initial trend change, and the later pullback that stays inside the confirmed direction.
Optional stop-loss and take-profit levels use the signal close as entry, an ATR multiple as the stop distance (1R), and your chosen R-multiple targets. The on-chart panel simulates closed-bar performance; it is not a broker-accurate backtest and does not account for slippage, commission, or intrabar movement.
Settings and workflow
ATR Length controls the volatility measurement window. Stage 1 Multiplier governs how closely the adaptive baseline follows price. Stage 2 Multiplier controls the trailing-band distance used to confirm direction changes. Raise Stage 2 if you want fewer, higher-conviction flips; lower it if you want earlier signals at the cost of more whipsaws.
Signal Cooldown (Bars) prevents repeated pullback markers from clustering. Max Pullbacks Per Trend caps how many pullback entries can appear before the next trend flip. Together, these settings let you control signal frequency and avoid overtrading a single trend leg.
Start with the defaults on a single instrument and timeframe. Observe which signals align with recognizable structure and which fire in choppy ranges. Adjust one input group at a time, first the ATR parameters, then the signal filters, and verify the behavior before applying it live.
Who should use this workflow
- Traders who want both trend direction and pullback timing in one tool, without switching between a trend overlay and a separate oscillator.
- Users who prefer closed-bar confirmation and are willing to sacrifice intrabar speed for reduced false signals.
- Forex, metals, indices, and crypto traders testing settings across 5-minute, 15-minute, hourly, and daily charts.
If you trade highly volatile instruments, expect the ATR bands to widen; if you trade low-volatility pairs, the bands will tighten. The tool adapts, but you still need to verify that the resulting signals match your session and risk rules.
What it does not do
It does not predict reversals. The tool reacts to closed bars; it cannot tell you a reversal is forming before price actually closes beyond the trailing band.
It does not filter by higher-timeframe structure. If the daily chart is in a strong downtrend and the 15-minute chart flips bullish, you will see a BUY trend flip. The tool does not know about the daily context unless you layer that analysis separately.
It does not account for news events or liquidity gaps. A sudden spike can flip the trend, trigger a pullback signal, then reverse again within minutes. The on-chart simulation cannot model slippage, spread widening, or overnight gaps.
It is not a complete trading system. You still need position sizing, a broader market context, and a plan for when a trend flip turns into a whipsaw. The tool provides entry candidates; it does not manage the trade after the marker appears.
Pairing with other tools
If you want higher-timeframe context, MTF Command Center TDV shows multiple timeframes in a single dashboard, helping you confirm that the pullback entry aligns with the larger trend. If you need precise support and demand zones to refine your entry or stop placement, Core Supply & Demand TDV marks where institutional interest has historically appeared.
Both tools are available in the TradingView catalog and can run on the same chart without performance issues.
Trading involves risk
Trading involves substantial risk and is not suitable for every investor. Past performance, whether shown in the on-chart panel or in your own testing, does not guarantee future results. This indicator does not provide financial, investment, or tax advice. You are responsible for your own trading decisions and for understanding the risks of leveraged products, volatile markets, and the instruments you trade.
Next step
If the pullback-or-chase dilemma has cost you trades, either by chasing breakouts into wide stops or by waiting so long the move finishes, Adaptive ATR Trend offers a structured way to separate confirmed direction from pullback timing. Review the settings, test the behavior on your instrument and timeframe, and decide whether the closed-bar workflow fits your session and risk rules.