How to Separate Trend Changes from Pullbacks Using Adaptive ATR
The whipsaw problem every trend trader faces
You're watching price move against your trend, and the question hits: is this the start of a reversal or just another pullback? Enter too early on noise, and you're stopped out before the trend resumes. Wait too long for confirmation, and the best entry is already gone. Most single-line trend tools can't separate the two because they respond to every volatility spike the same way.
Adaptive ATR Trend MT4 was built to address that problem by using a cascading two-stage structure that adapts to current volatility while filtering out ordinary candle movement.
What it does
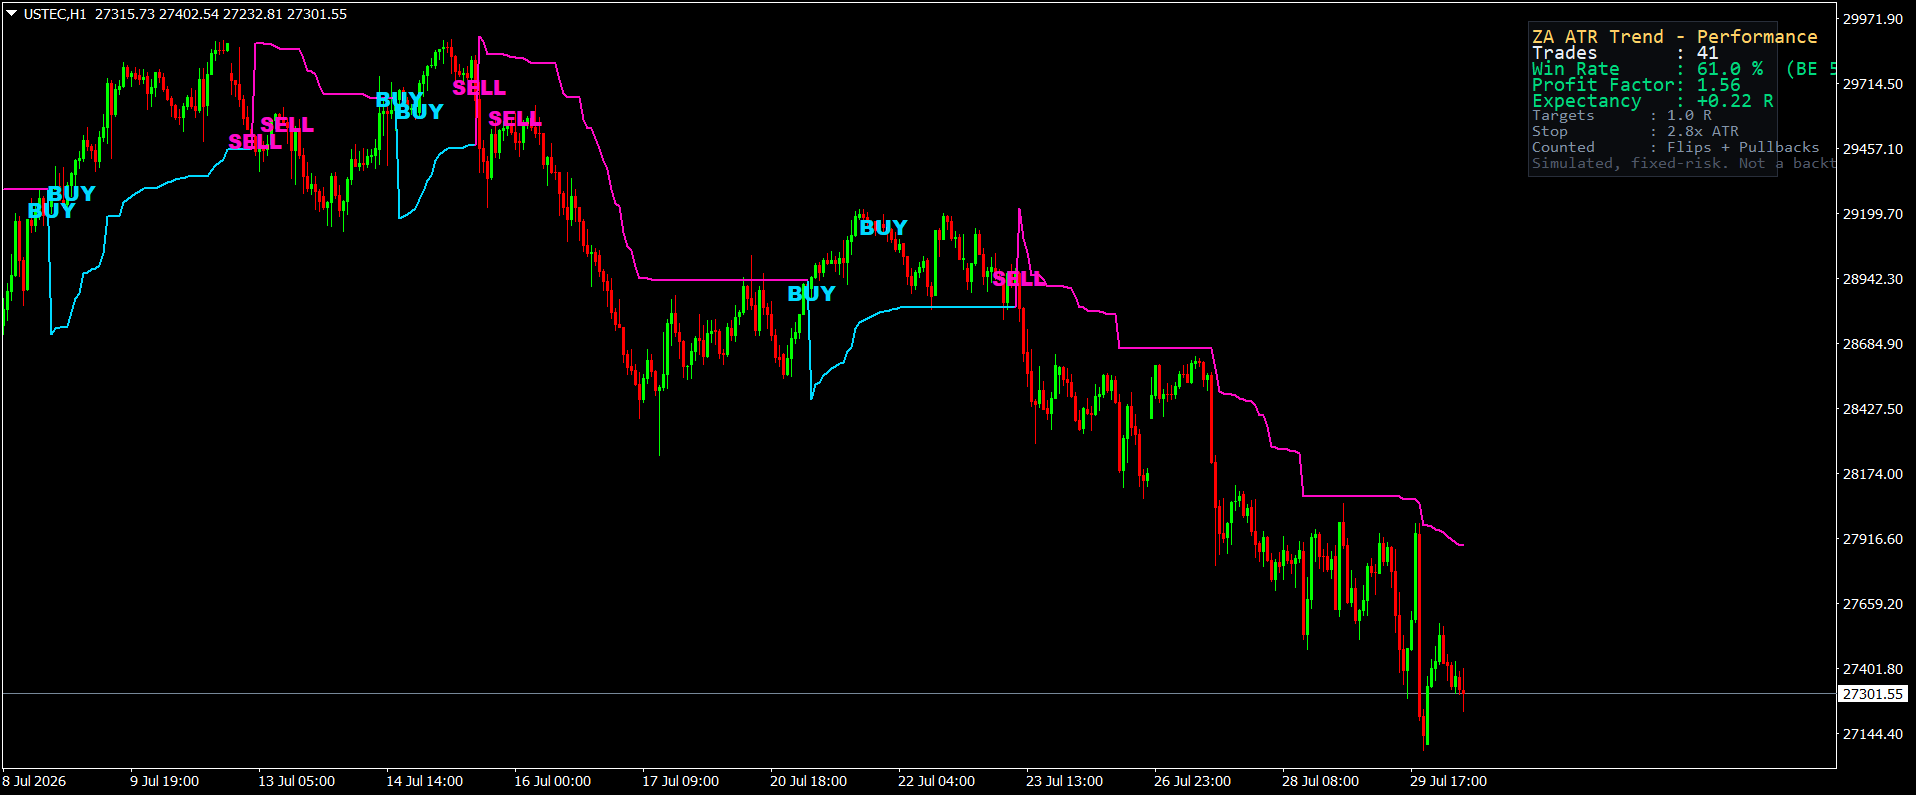
The indicator runs two ATR layers. The first stage builds an adaptive baseline that follows price while adjusting to the current Average True Range. The second stage wraps wider trailing bands around that baseline and confirms a directional change only when a closed bar crosses beyond the active boundary. This separation helps distinguish a genuine trend flip from intrabar noise or a single volatile candle.
Once the trend state is established, bullish or bearish, the tool monitors Heikin Ashi candle transitions to identify pullback entries that resume the active direction. A cooldown period and a maximum-signals-per-trend limit prevent overtrading during choppy phases.
The tool generates two types of signals:
- Trend flip, price closed beyond the trailing boundary, reversing the ATR trend state from bearish to bullish or vice versa.
- Pullback entry, during an established trend, the Heikin Ashi state flipped back in favor of the trend direction, passing cooldown and per-trend limits.
Each signal displays a marker with a reason label, and optional stop-loss and take-profit levels are calculated using an ATR multiple from the signal close.
How it is used in a real session
You open MT4, attach Adaptive ATR Trend to EUR/USD on the 1-hour chart, and leave the default settings. The trend line color shows the current state. After a few hours of sideways movement, price closes above the upper trailing band and a BUY trend-flip signal appears with the label "Trend flipped bullish." You note the entry price and the plotted stop-loss level.
Two hours later, price pulls back and forms two bearish candles. The trend line stays bullish, and a second BUY signal appears, this time labeled "Heikin Ashi pullback resumed the active trend." The cooldown period has passed, so the signal is valid. You compare the risk-to-reward setup against your plan and decide whether to add to the position or wait.
You adjust one input at a time, first the Stage 2 Multiplier to tighten or widen the confirmation band, then the Heikin Ashi sensitivity, and rerun the chart to see how signal frequency and placement change. You do not backtest for a win rate; you verify that the signals align with the market structure you recognize.
Who it fits
- Trend traders who want both directional confirmation and pullback timing in one tool.
- MT4 users trading forex pairs, metals, indices, or crypto who prefer closed-bar signals over live repainting.
- Traders testing multi-timeframe setups, confirming trend on the 4-hour, entering pullbacks on the 1-hour.
- Anyone frustrated by single-line moving averages that whipsaw during range expansion.
The tool works best when you already understand trend structure and pullback rhythm. It's a decision aid, not a standalone system.
What it does not do
Adaptive ATR Trend does not predict where price will go next. It reacts to closed bars, so during fast moves you will see the signal after the initial momentum has already started.
It does not account for fundamentals, news events, or session liquidity. A trend-flip signal can appear moments before a central bank announcement that reverses the move.
The Heikin Ashi pullback logic reduces some noise but will still produce signals during low-conviction chop if the ATR parameters are too tight for the current market.
The panel's simulation is a closed-bar approximation, not a broker-accurate backtest. Slippage, spread, swap, and partial fills are not modeled. You cannot extract a reliable win rate or expectancy from the on-chart display.
Finally, the tool does not manage your position. It shows where a setup occurred; you still decide size, whether to scale in, when to move your stop, and when to exit.
How it pairs with other tools in the catalog
Adaptive ATR Trend defines the directional bias and flags pullback zones. If you want additional confirmation at structural levels, Swing Trendline Break & Fakeout MT4 can help you see whether price is respecting or breaking a drawn trendline at the same moment a pullback signal appears.
For traders who also watch round-number zones, Big Figure Trap Signals MT4 identifies when price traps stops near psychological levels, useful context when a trend-flip signal lands just above or below a major figure.
Pairing does not improve the probability of any single trade. It adds perspective, and perspective costs screen space and attention. Use the minimum number of tools that answer your actual questions.
Getting started
Adaptive ATR Trend MT4 is available now in the ZynAlgo marketplace. Attach it to one chart, one timeframe, and one instrument. Leave the defaults, watch ten to twenty signals form, and ask whether the trend-flip and pullback labels match the structure you see. Then adjust one input group, ATR length, Stage 1 or Stage 2 multiplier, Heikin Ashi settings, and compare. Favor clarity and repeatability over signal count.
Trading involves substantial risk of loss. This indicator does not provide investment advice, and no tool can guarantee future performance. Test any approach in a demo environment before committing real capital.