How to Reduce Trend Indicator Whipsaws with Adaptive ATR Filtering
The whipsaw problem every trend trader recognizes
You apply a moving-average crossover or a simple trend line, and it changes direction three times in an hour, each flip looks valid until the next bar proves it was noise. You exit a profitable position because the indicator turned, only to watch price resume the original trend without you. The core issue is not whether trend exists; it is that single-layer tools treat every breach as equally important.
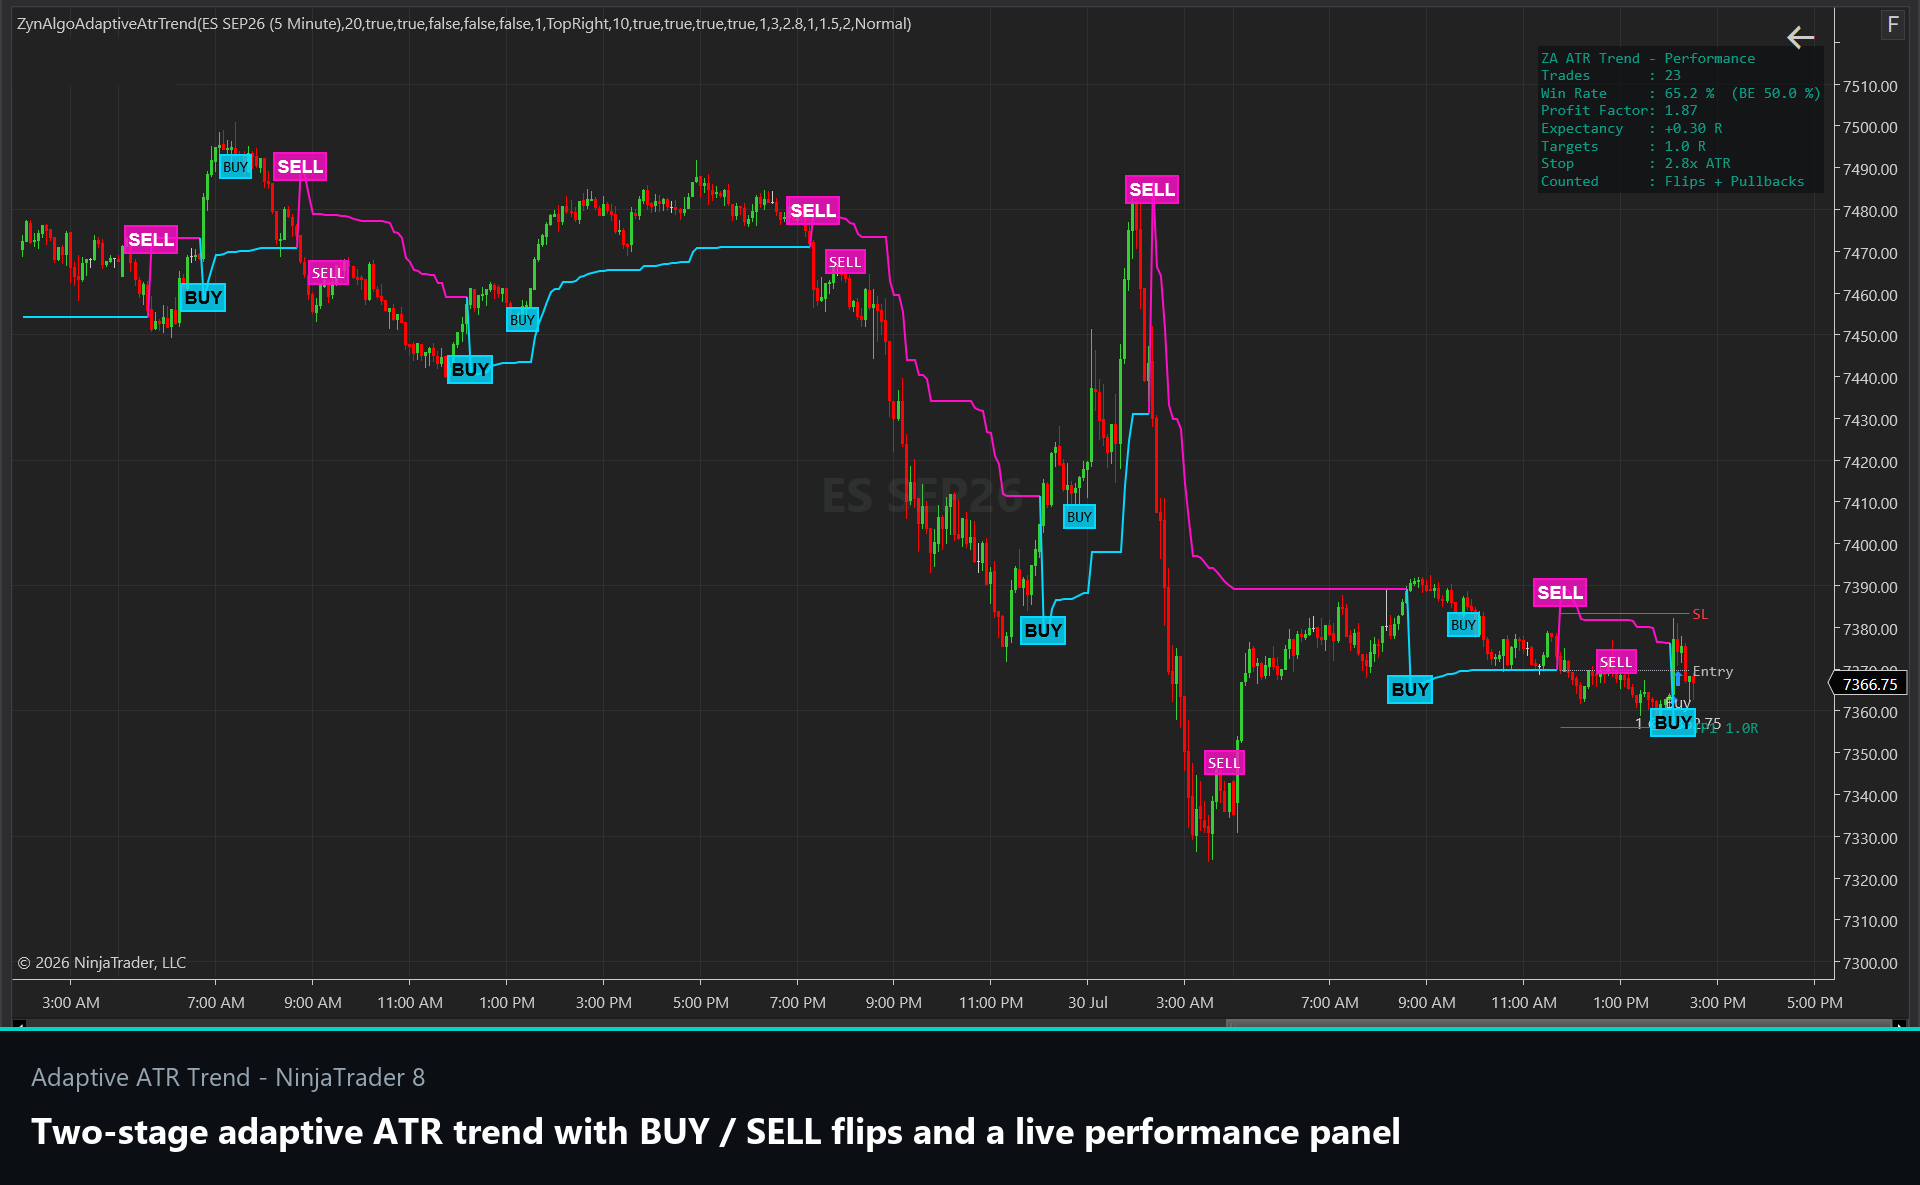
Adaptive ATR Trend NT8 addresses this by running two ATR stages in sequence: a close-following baseline that adapts to current volatility, and a wider trailing boundary that confirms direction only when price closes decisively beyond it. The result is fewer direction changes and a clearer distinction between a genuine trend flip and a brief counter-move.
What the two-stage ATR structure does
The first stage calculates a baseline that follows price while scaling to the instrument's current Average True Range. This baseline is responsive but not yet a directional verdict. The second stage places trailing bands at a larger ATR multiple around that baseline. The tool declares a bullish trend when price closes above the upper boundary, and a bearish trend when it closes below the lower one. Between those boundaries, the existing trend state persists.
This cascading design filters out the small pullbacks and inside-bar clusters that cause single-layer indicators to flip prematurely. You see a trend-line color on the chart, bullish or bearish, and it changes only when the closed bar meets the second-stage threshold.
Key inputs
- ATR Length: the lookback window for volatility measurement.
- Stage 1 Multiplier: controls how tightly the adaptive baseline tracks price.
- Stage 2 Multiplier: sets the distance of the trailing boundary that confirms direction.
Increasing the Stage 2 multiplier will reduce the number of trend flips but may delay recognition of genuine reversals. Lowering it makes the tool more sensitive but reintroduces some whipsaw risk. The defaults offer a balanced starting point; adjust one input at a time and verify behavior on your specific instrument and timeframe.
How to reduce trend indicator whipsaws in a live session
Open NinjaTrader 8 and load the indicator on the chart you intend to trade. The trend line appears in one of two colors, showing the current directional state. When the closed bar pushes price through the active trailing boundary, the color switches and a trend flip marker appears with the reason "Trend flipped bullish" or "Trend flipped bearish."
Once a trend is established, the tool can also generate pullback entries. These occur when the Heikin Ashi calculation detects a resumption of the active trend after a brief counter-move, subject to a cooldown period and a maximum number of pullbacks per trend. The marker reason will read "Heikin Ashi pullback resumed the active trend."
Each signal includes optional stop-loss and take-profit levels. The stop is placed at an ATR multiple from the signal close (treating that distance as 1R), and the take-profit targets are set at your chosen R multiples. The on-chart panel shows a simplified closed-bar simulation to help you review past signals; it is not a broker-accurate backtest and does not account for slippage or commission.
Typical workflow
- Confirm the trend-line color matches your directional bias.
- Wait for a trend-flip or pullback marker on a closed bar.
- Review the marker reason to understand whether it is a new trend or a resumption.
- If the signal aligns with your broader analysis, plan entry near the signal close with the displayed stop level.
- Manage the position according to your risk rules; the R-target levels are reference points, not automatic exits.
This closed-bar confirmation removes intrabar repainting. What you see after the bar closes is final.
Who should use this approach
Adaptive ATR Trend fits traders who:
- Operate on trending instruments (forex pairs, metals, indices, crypto) where volatility varies throughout the session.
- Prefer to wait for closed-bar confirmation rather than acting on every intrabar tick.
- Want both initial trend-flip entries and structured pullback entries without switching between multiple indicators.
- Are willing to test and adjust multiplier settings to match their timeframe and instrument characteristics.
It works across timeframes, but the optimal ATR length and Stage 2 multiplier will differ between a 5-minute scalp chart and a daily swing chart. Start with the defaults, run the simulation panel over recent history, and adjust one parameter at a time. Favor repeatable signal context over raw signal quantity.
What it does not do
Adaptive ATR Trend does not predict where price will go next. It identifies when the current volatility-adjusted structure has shifted direction and when a pullback has resumed an existing trend, but it cannot tell you whether that trend will continue or fail.
It will not perform well in tight, low-volatility ranges where price oscillates without building directional momentum. In those conditions the trailing boundaries may contract, and small moves can trigger false trend flips. If your instrument is consolidating inside a narrow range, the two-stage filter will reduce whipsaws compared to a single moving average, but it will not eliminate them entirely.
The tool does not incorporate volume, order flow, or fundamental data. It reads price and ATR only. If your trading process depends on confirming trend direction with volume divergence or sentiment data, you will need a separate tool for that layer.
Finally, the stop-loss and take-profit levels are calculated references, not live orders. You must place and manage your own trades; the indicator does not interface with your broker.
Pairing with other tools
Because Adaptive ATR Trend focuses on directional structure and timing, it pairs naturally with tools that add context about where that trend sits within a larger cycle. Quant Regime Classifier NT8 categorizes the current market state (trending vs. mean-reverting) and can help you decide whether to take trend-flip signals aggressively or wait for pullbacks. Phase Filter NT8 applies a similar volatility-adaptive concept to identify when momentum is accelerating or decelerating, offering a second layer of confirmation before entry.
Use complementary tools to answer the questions Adaptive ATR Trend does not address, regime, momentum phase, or higher-timeframe alignment, rather than stacking multiple trend indicators that will produce redundant signals.
Getting started
Load Adaptive ATR Trend NT8 on a chart of the instrument you trade most often. Run the simulation panel over the past 100-200 bars and observe how many trend flips occurred, how many pullbacks were signaled, and whether the stop and target levels aligned with actual price movement. If you see excessive flips, increase the Stage 2 Multiplier by 0.5 and re-run. If you see too few signals or very late entries, reduce it by 0.5.
Once the settings produce a reasonable signal density, forward-test on a demo account or in a small live position. Track how often the trend-line color matched your broader directional read, and whether the closed-bar confirmation helped you avoid premature entries. Adjust the cooldown and maximum-pullbacks-per-trend settings if you want tighter control over signal frequency.
Remember that no indicator removes the need for risk management. Size your positions according to the stop distance, and exit or adjust when your thesis changes, not just when the trend line flips color.
---
Trading involves substantial risk. This indicator does not provide financial advice or guarantee future performance. Past simulation results do not predict actual trading outcomes.